. 2024 Jan 18;14(5):727–736. doi: 10.1158/2159-8290.CD-23-1138

Figure 1.

Figure 1. Distinct RAS isoform selectivity profiles of KRASG12C inhibitors. A, Amino acid sequence aligments of the four RAS family isoforms, including KRAS4A and KRAS4B, NRAS, and HRAS. Amino acid differences are shown in red and blue. Regions involved in the switch-II binding pocket are shaded in green and the hypervariable region is shaded in purple. B, Ba/F3 cells engineered to express either KRASG12C, NRASG12C, HRASG12C, or KRASG12D were treated for 72 hours in the absence of IL3 with various concentrations of the indicated inhibitors. Viable cell titer was measured using CellTiter Glo. C, Ba/F3 cells engineered to express the various mutant forms of KRAS, NRAS, and HRAS were treated for 72 hours with a range of concentrations of the indicated inhibitors and viable cell titer was assessed as in B.

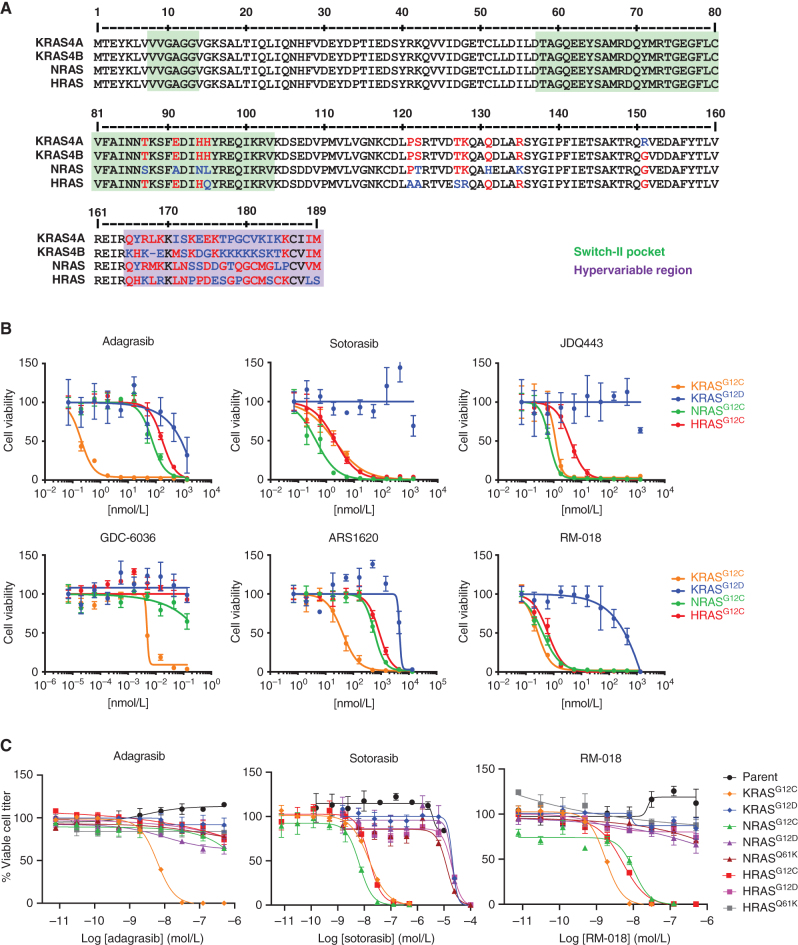
Distinct RAS isoform selectivity profiles of KRASG12C inhibitors. A, Amino acid sequence aligments of the four RAS family isoforms, including KRAS4A and KRAS4B, NRAS, and HRAS. Amino acid differences are shown in red and blue. Regions involved in the switch-II binding pocket are shaded in green, and the hypervariable region is shaded in purple. B, Ba/F3 cells engineered to express either KRASG12C, NRASG12C, HRASG12C, or KRASG12D were treated for 72 hours in the absence of IL3 with various concentrations of the indicated inhibitors. Viable cell titer was measured using CellTiter Glo. C, Ba/F3 cells engineered to express the various mutant forms of KRAS, NRAS, and HRAS were treated for 72 hours with a range of concentrations of the indicated inhibitors, and viable cell titer was assessed as in B.