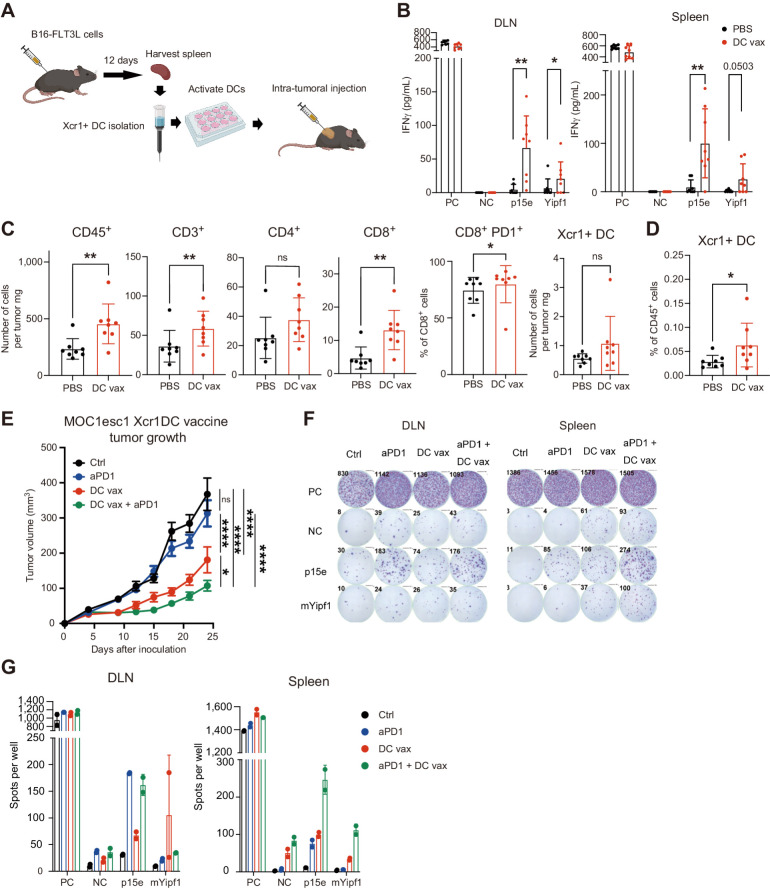
Figure 3.
Xcr1+ DC vaccine is sufficient to induce antigen-reactive T cells, alter the tumor microenvironment and attenuate tumor growth in aPD1-resistant mouse model. A, DC generation, Xcr1+ DC isolation, and Xcr1+ DC intratumoral vaccine. Vaccination was performed with 1 million Xcr1+ DC. B, CD8+ T cells were isolated from intratumoral DC-vaccinated MOC1esc1 mouse DLN or spleen on day 14 after inoculation, stimulated with peptides and evaluated for reactivity by IFNγ ELISA. PC; positive control (PMA + ionomycin), NC; negative control (no peptides), or p15e or mYipf1 peptide (0.1 μmol/L) stimulation. (n = 8, representative data of two independent experiments). C and D, Flow-cytometric analysis of MOC1esc1 tumors (C) and DLN (D) treated with intratumoral PBS or DC vaccine on days 1/4/7 after inoculation and harvested on day 14 after tumor inoculation. (n = 8, representative data of two independent experiments, gating strategies shown in Supplementary Fig. S2F and S2G). E, Tumor growth of aPD1-resistant MOC1esc1 model treated with intratumoral PBS (on days 1/4/7), intraperitoneal aPD1 (250 μg on days 3/6/9), intratumoral DC vaccine (1 million Xcr1+ DC on days 1/4/7), or the combination. n = 8 per group. F, DLN and spleens of MOC1esc1-bearing mice treated as in E (separate experiment) were harvested on day 13 after inoculation and cocultured with indicated peptides to test reactivity evaluated by IFNγ ELISPOT. PC; positive control (PMA + ionomycin), NC; negative control (no peptides), or p15e + mYipf1 peptide (0.1 μmol/L) stimulation. (n = 8 per group). G, Quantification of spots analyzed in experiment F. (n = 2). Individual data with mean ± SD are plotted in B–D. Data are plotted as mean ± SEM in E. Data were analyzed using the Mann–Whitney U test to generate two-tailed P values in B–D. Two-way ANOVA with multiple comparison was used for growth curve analysis in E. (A was generated by using BioRender under granted license.) *, P < 0.05; **, P < 0.01; ****, P < 0.0001.

