. 2024 Feb 16;30(9):1916–1933. doi: 10.1158/1078-0432.CCR-23-3433

Figure 1.

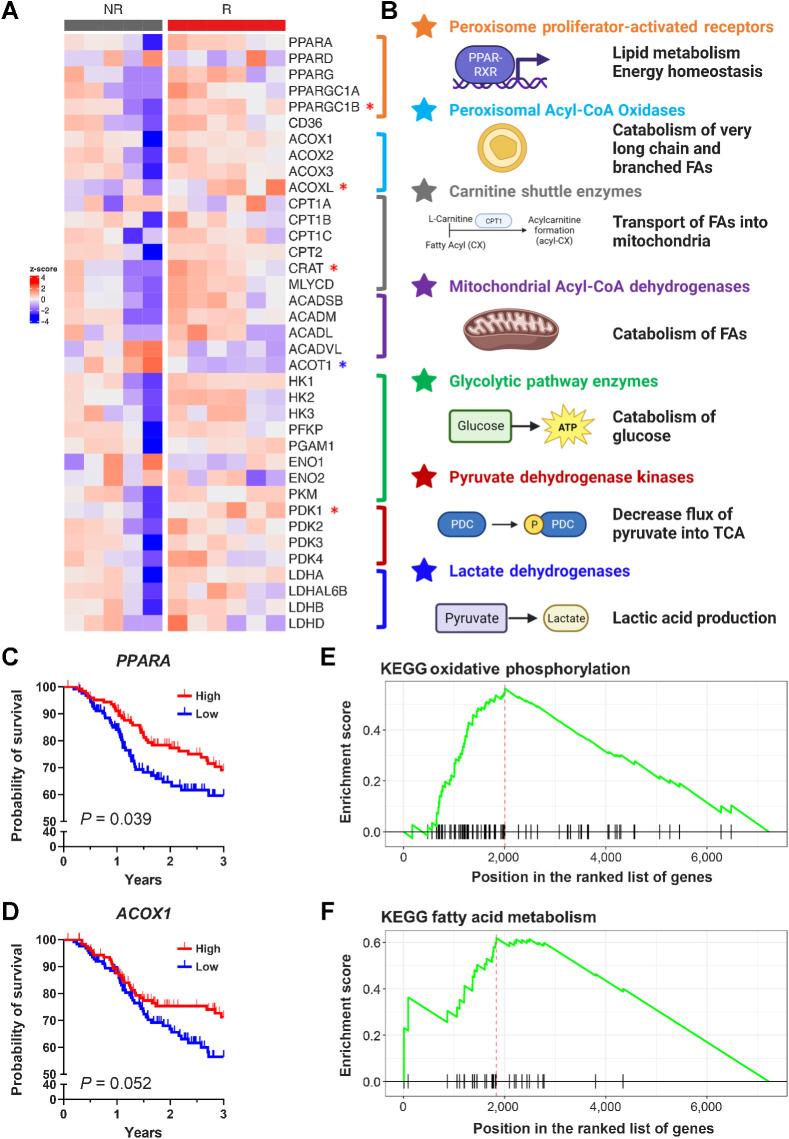
Figure 1. FA metabolism is altered in HPV-unrelated HNC and upregulated FA catabolism correlates with response to neoadjuvant SBRT with checkpoint blockade. A, Z-score of genetic expression of selected genes derived from RNA-seq from human samples from Darragh and colleagues (20). Significantly upregulated in responders by those shown with the red asterisk, whereas significantly downregulated shown with the blue asterisk (Mann–Whitley test, P < 0.05). B, Selected genes coded by color: PPARs (orange), peroxisomal acyl-CoA oxidases (light blue), carnitine shuttle enzymes (gray), mitochondrial acyl-CoA dehydrogenases (purple), glycolytic enzymes (green), pyruvate dehydrogenase kinases (red), and lactate dehydrogenases (dark blue). C and D, Overall survival of patients from TCGA H&N cohort split into high or low genetic expression PPARA (C; log2 normalized count cut point of 9.214) and ACOX1 (D; log2 normalized count cut point of 10.38). P values calculated with the log-rank test. E and F, GSEA of KEGG pathways showing enrichment of oxidative phosphorylation (E) and FA metabolism (F) in the MEER responder cell line in comparison with the MOC2 nonresponder cell line. (B, Created with BioRender.com.)

FA metabolism is altered in HPV-unrelated HNC and upregulated FA catabolism correlates with response to neoadjuvant SBRT with checkpoint blockade. A, Z-score of genetic expression of selected genes derived from RNA-seq from human samples from Darragh and colleagues (20). Significantly upregulated in responders by those shown with the red asterisk, whereas significantly downregulated shown with the blue asterisk (Mann–Whitley test, P < 0.05). B, Selected genes coded by color: PPARs (orange), peroxisomal acyl-CoA oxidases (light blue), carnitine shuttle enzymes (gray), mitochondrial acyl-CoA dehydrogenases (purple), glycolytic enzymes (green), pyruvate dehydrogenase kinases (red), and lactate dehydrogenases (dark blue). C and D, Overall survival of patients from TCGA H&N cohort split into high or low genetic expression PPARA (C; log2 normalized count cut point of 9.214) and ACOX1 (D; log2 normalized count cut point of 10.38). P values calculated with the log-rank test. E and F, GSEA of KEGG pathways showing enrichment of oxidative phosphorylation (E) and FA metabolism (F) in the MEER responder cell line in comparison with the MOC2 nonresponder cell line. (B, Created with BioRender.com.)