. 2024 Feb 16;30(9):1916–1933. doi: 10.1158/1078-0432.CCR-23-3433

Figure 2.

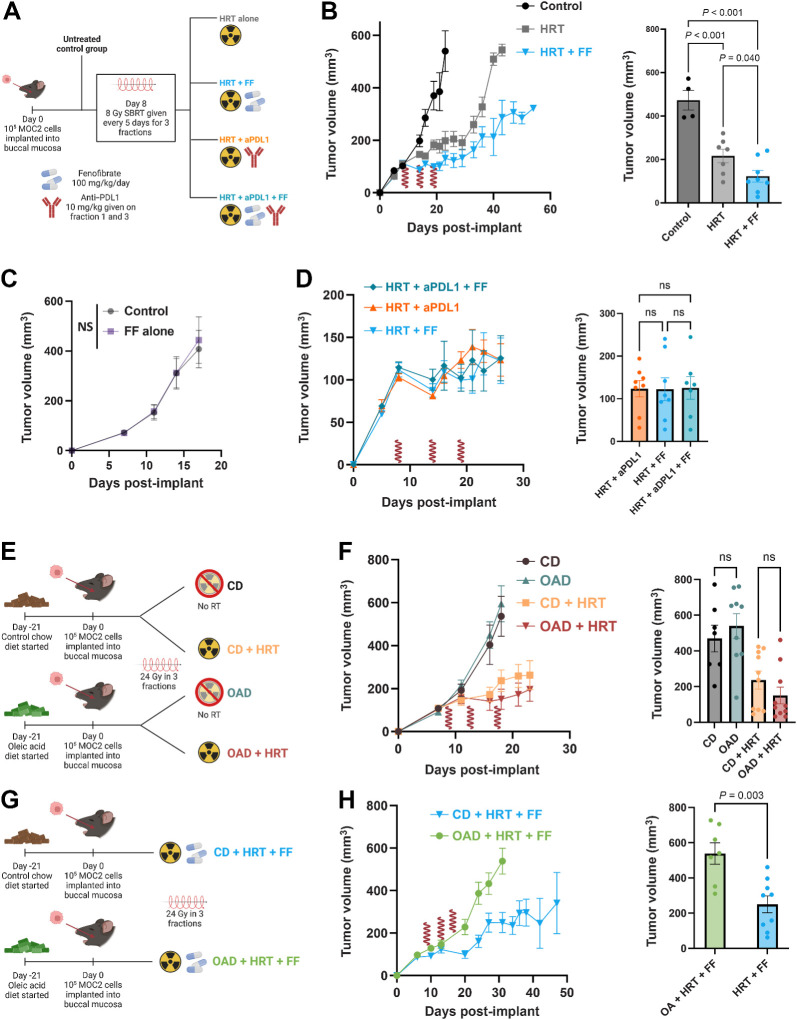
Figure 2. FF enhances antitumor efficacy of HRT, whereas OAD results in effect reversal. A, Schematic for experimental design with the following MOC2 groups (n = 8 per group): no treatment control (black), HRT alone (gray), HRT with FF (blue), HRT with aPDL1 (orange), HRT with FF and aPDL1 (teal). FF was started on day 5 after the first HRT fraction. HRT delivered as 24 Gy in 3 fractions (shown as red waves). All mice were on the CD. B, Tumor volume curve with day 26 mean volume. HRT fractions are denoted with a red wave. P values generated with an ordinary one-way ANOVA with multiple comparisons correction. HRT fractions are denoted with a red wave symbol. C, Tumor volume curve comparing control to daily FF (started on day 12, 100 mg/kg/day) alone. There was no difference between groups on day 17 (P = 0.721). D, Tumor growth curve and day 26 mean tumor volume showing HRT with FF vs. HRT with aPDL1 vs. HRT with both. There were no significant differences between groups (all P > 0.05 one-way ANOVA; P = 0.9961). FF was started on day 5 after the first HRT fraction. HRT delivered as 24 Gy in 3 fractions (shown as red waves). E, Schematic for experiment comparing CD vs. OAD with or without HRT (n = 10 mice in each group). F, Mean tumor volume curve with SEM for mice with buccal tumors irradiated to 24 Gy in 3 fractions who were fed the CD versus the OAD. Mann–Whitney test of mean tumor volume at day 18 was nonsignificant (P = 0.255). Mean tumor volume with SEM curve for mice fed the CD versus the OAD. Mann–Whitney test of mean tumor volume at day 18 was nonsignificant (P = 0.573). G, Schematic for experimental design with the following MOC2 groups (n = 10 mice in each group): OAD with HRT and FF (green) and control diet with HRT and FF (blue). H, Tumor volume curve for the OAD experiment with day 31 average tumor volumes and average weight over time. FF was started on day 5 after the first HRT fraction. HRT delivered as 24 Gy in 3 fractions (shown as red waves). Mean tumor volume at day 31 in the OAD (green) vs. the CD group (blue). P value generated from the Mann–Whitney test. (A, E, G, Created with BioRender.com.)

FF enhances antitumor efficacy of HRT, whereas OAD results in effect reversal. A, Schematic for experimental design with the following MOC2 groups (n = 8 per group): no treatment control (black), HRT alone (gray), HRT with FF (blue), HRT with aPDL1 (orange), HRT with FF and aPDL1 (teal). FF was started on day 5 after the first HRT fraction. HRT delivered as 24 Gy in 3 fractions (shown as red waves). All mice were on the CD. B, Tumor volume curve with day 26 mean volume. HRT fractions are denoted with a red wave. P values generated with an ordinary one-way ANOVA with multiple comparisons correction. HRT fractions are denoted with a red wave symbol. C, Tumor volume curve comparing control to daily FF (started on day 12, 100 mg/kg/day) alone. There was no difference between groups on day 17 (P = 0.721). D, Tumor growth curve and day 26 mean tumor volume showing HRT with FF vs. HRT with aPDL1 vs. HRT with both. There were no significant differences between groups (all P > 0.05 one-way ANOVA; P = 0.9961). FF was started on day 5 after the first HRT fraction. HRT delivered as 24 Gy in 3 fractions (shown as red waves). E, Schematic for experiment comparing CD vs. OAD with or without HRT (n = 10 mice in each group). F, Mean tumor volume curve with SEM for mice with buccal tumors irradiated to 24 Gy in 3 fractions who were fed the CD versus the OAD. Mann–Whitney test of mean tumor volume at day 18 was nonsignificant (P = 0.255). Mean tumor volume with SEM curve for mice fed the CD versus the OAD. Mann–Whitney test of mean tumor volume at day 18 was nonsignificant (P = 0.573). G, Schematic for experimental design with the following MOC2 groups (n = 10 mice in each group): OAD with HRT and FF (green) and control diet with HRT and FF (blue). H, Tumor volume curve for the OAD experiment with day 31 average tumor volumes and average weight over time. FF was started on day 5 after the first HRT fraction. HRT delivered as 24 Gy in 3 fractions (shown as red waves). Mean tumor volume at day 31 in the OAD (green) vs. the CD group (blue). P value generated from the Mann–Whitney test. (A, E, G, Created with BioRender.com.)