. 2024 Feb 16;30(9):1916–1933. doi: 10.1158/1078-0432.CCR-23-3433

Figure 3.

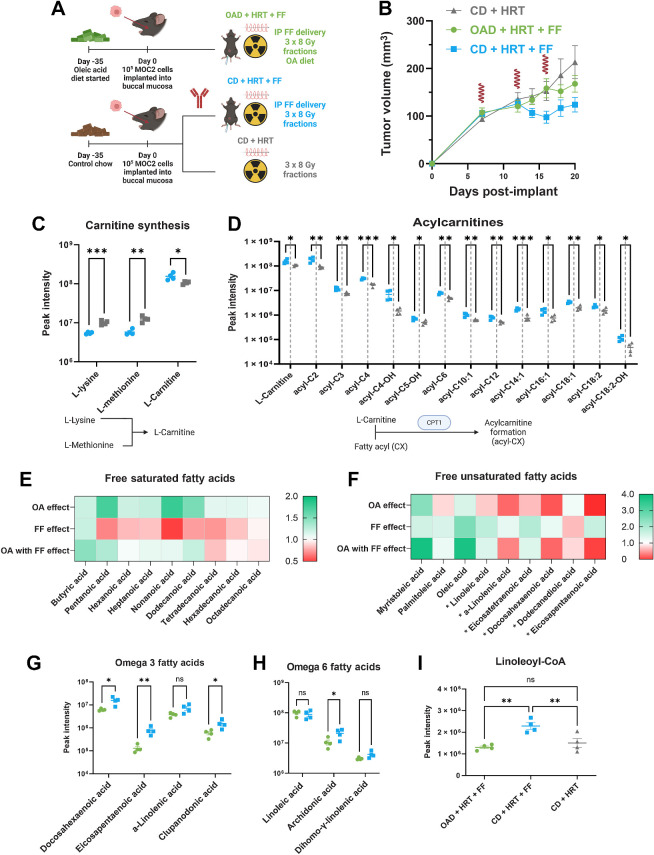
Figure 3. FF upregulated acyl-carnitine formation and fatty acid catabolism whereas the OAD results in significantly lower serum omega 3 and 6 fatty acids. A, Schematic for in vivo experiment for mechanistic evaluation (n = 10 mice per group). The mice were euthanized on day 20 for metabolomics, proteomics, and flow cytometry. The following graphics show groups: CD + HRT (gray), CD + HRT + FF (blue), OAD + HRT + FF (green). B, MOC2 tumor volume curve with 24 Gy HRT in 3 fractions given on days 7, 12, and 16. FF (100 mg/kg/day) was started on day 12. HRT fractions are shown as red waves. C and D, L-Carnitine is increased in FF compared with mice not on FF (C); acyl-carnitines are generally upregulated in FF-treated mice (D). Below each graph shows a schematic outlining the metabolic pathway involved. P values generated using multiple unpaired t tests (*, P <0.05; **, < 0.01; ***, <0.001). E and F, Fold change heat map of saturated and unsaturated FAs comparing mice on the OAD with HRT/FF vs. control diet with HRT/FF (OA effect); mice on the control diet treated with HRT/FF vs. HRT alone (FF effect); and mice on the OAD treated with HRT/FF vs. mice on the control diet treated with HRT alone (OA with FF effect). The FAs denoted with an asterisk (*) are PUFAs. G–I, Omega 3 FAs (G) and omega 6 FAs (H) are decreased in the OAD + HRT + FF group (green) in comparison with the CD + HRT + FF group (blue); linoleoyl-CoA (I) was higher in the HRT + FF group (blue) in comparison with the OA + HRT + FF group (green) and the CD + HRT group (gray). P values generated using multiple unpaired t tests or ordinary one-way ANOVA for 3 groups without multiple comparison correction (*, P < 0.05; **, P < 0.01). PUFA, polyunsaturated fatty acid. (A, Created with BioRender.com.)

FF upregulated acyl-carnitine formation and fatty acid catabolism whereas the OAD results in significantly lower serum omega 3 and 6 fatty acids. A, Schematic for in vivo experiment for mechanistic evaluation (n = 10 mice per group). The mice were euthanized on day 20 for metabolomics, proteomics, and flow cytometry. The following graphics show groups: CD + HRT (gray), CD + HRT + FF (blue), OAD + HRT + FF (green). B, MOC2 tumor volume curve with 24 Gy HRT in 3 fractions given on days 7, 12, and 16. FF (100 mg/kg/day) was started on day 12. HRT fractions are shown as red waves. C and D, L-Carnitine is increased in FF compared with mice not on FF (C); acyl-carnitines are generally upregulated in FF-treated mice (D). Below each graph shows a schematic outlining the metabolic pathway involved. P values generated using multiple unpaired t tests (*, P <0.05; **, < 0.01; ***, <0.001). E and F, Fold change heat map of saturated and unsaturated FAs comparing mice on the OAD with HRT/FF vs. control diet with HRT/FF (OA effect); mice on the control diet treated with HRT/FF vs. HRT alone (FF effect); and mice on the OAD treated with HRT/FF vs. mice on the control diet treated with HRT alone (OA with FF effect). The FAs denoted with an asterisk (*) are PUFAs. G–I, Omega 3 FAs (G) and omega 6 FAs (H) are decreased in the OAD + HRT + FF group (green) in comparison with the CD + HRT + FF group (blue); linoleoyl-CoA (I) was higher in the HRT + FF group (blue) in comparison with the OA + HRT + FF group (green) and the CD + HRT group (gray). P values generated using multiple unpaired t tests or ordinary one-way ANOVA for 3 groups without multiple comparison correction (*, P < 0.05; **, P < 0.01). PUFA, polyunsaturated fatty acid. (A, Created with BioRender.com.)