. 2024 Feb 16;30(9):1916–1933. doi: 10.1158/1078-0432.CCR-23-3433

Figure 4.

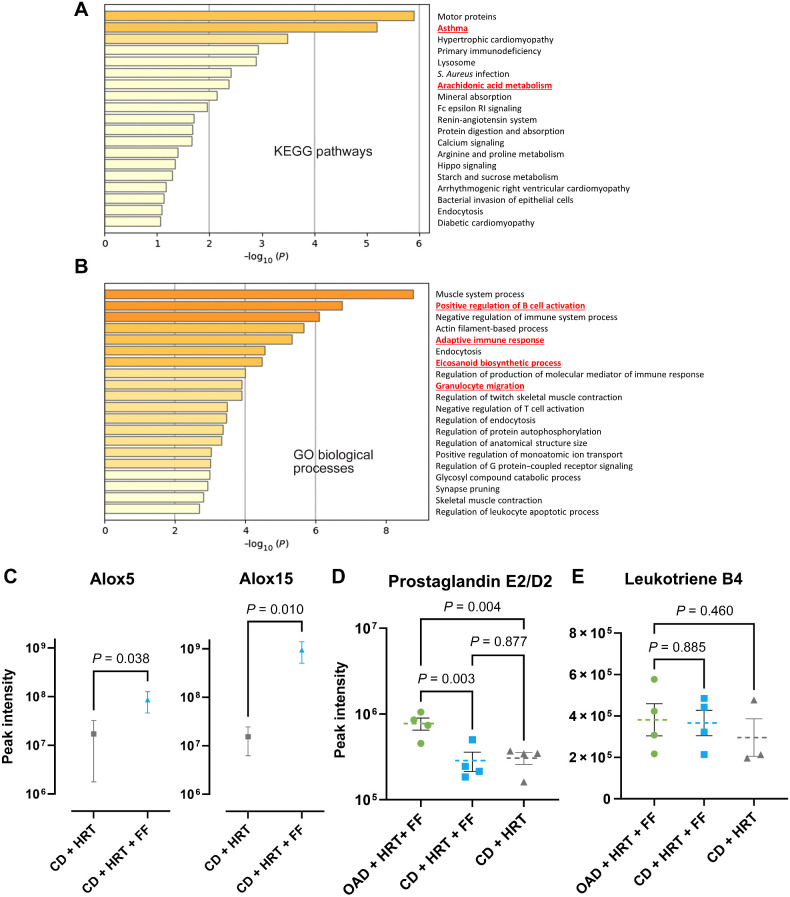
Figure 4. Proteomic analyses reveal that in addition to HRT upregulation of antigen presentation, FF alters arachidonic acid metabolism. A and B, Bulk proteomic pathway analyses showing KEGG pathways (A) or GO processes (B) that were upregulated in FF + HRT compared with HRT alone. DGE terms with P < 0.15 and pathway analyses with P ≤ 0.1. C, Spectral intensity of Alox5 and Alox15 proteins. Mann–Whitney test was used to compare means. D and E, Oxylipin analysis with expression of prostaglandin E2/D2 (D) and leukotriene B4 (E) within the OAD + HRT + FF (green), CD + HRT + FF (blue), and CD + HRT (gray) groups.

Proteomic analyses reveal that in addition to HRT upregulation of antigen presentation, FF alters arachidonic acid metabolism. A and B, Bulk proteomic pathway analyses showing KEGG pathways (A) or GO processes (B) that were upregulated in FF + HRT compared with HRT alone. DGE terms with P < 0.15 and pathway analyses with P ≤ 0.1. C, Spectral intensity of Alox5 and Alox15 proteins. Mann–Whitney test was used to compare means. D and E, Oxylipin analysis with expression of prostaglandin E2/D2 (D) and leukotriene B4 (E) within the OAD + HRT + FF (green), CD + HRT + FF (blue), and CD + HRT (gray) groups.