. 2024 Feb 16;30(9):1916–1933. doi: 10.1158/1078-0432.CCR-23-3433

Figure 5.

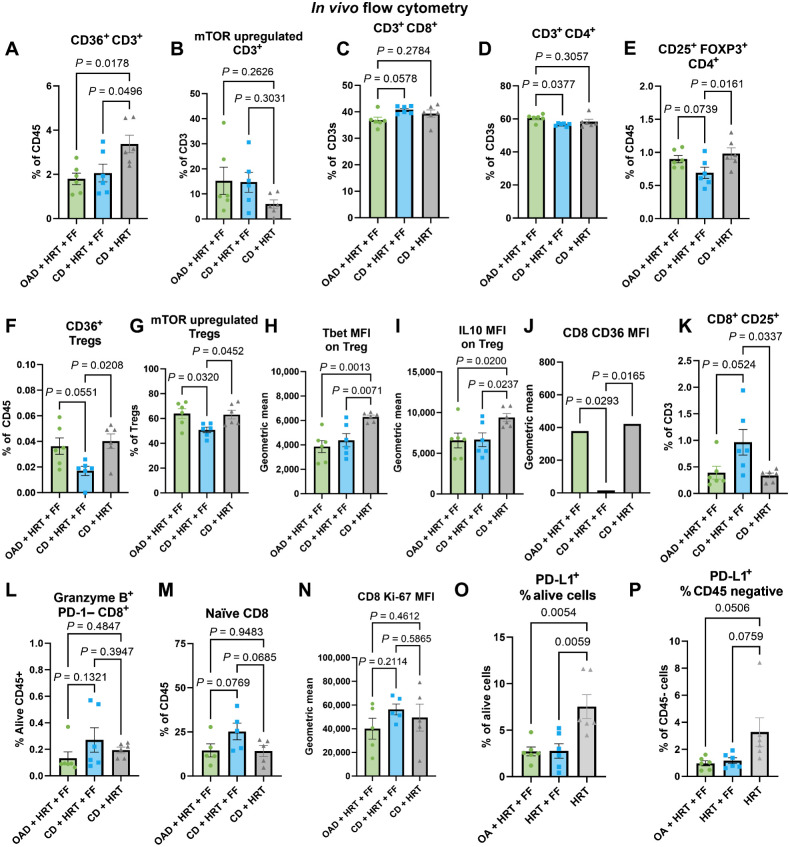
Figure 5. In vivo flow-cytometric characterization of the immunologic effects of FF and OA. A and B, Flow cytometry results from the excised tumors from the in vivo experiment comparing OAD + HRT + FF (green) with CD + HRT + FF (blue) and CD + HRT (gray), including CD36+ CD3+ T cells (A) and mTOR upregulated CD3+ T cells (B). C–I, Flow cytometry results from the draining lymph node from the in vivo experiment comparing OAD + HRT + FF (green) with CD + HRT + FF (blue) and CD + HRT (gray). Included gating: CD8+ T cells (C), CD4+ T cells (D), CD25+ FOXP3+ regulatory T cells (E), CD36+ regulatory T cells (F), and mTOR upregulated (p4EBP1 and pS6 ribosomal protein) regulatory T cells (G). Geometric MFI is shown for Tbet and IL10 expression on regulatory T cells (H–I). J–L, Flow cytometry results from the draining lymph node from the in vivo experiment comparing OAD + HRT + FF (green) with CD + HRT + FF (blue) and CD + HRT (gray). Included MFI of CD36 on CD8s (J), CD25+ CD8+ T cells (K), and granzyme B+ PD-1– CD8+ T cells (L). M–P, Flow cytometry results from the excised tumors from the in vivo experiment comparing OAD + HRT + FF (green) with CD + HRT + FF (blue) and CD + HRT (gray), including naïve CD44− CD62 L high CD8 T cells (J), MFI of Ki-67 on CD8 T cells (K), PD-L1+ alive cells (O), and PD-L1+ CD45-negative cells (P).

In vivo flow-cytometric characterization of the immunologic effects of FF and OA. A and B, Flow cytometry results from the excised tumors from the in vivo experiment comparing OAD + HRT + FF (green) with CD + HRT + FF (blue) and CD + HRT (gray), including CD36+ CD3+ T cells (A) and mTOR upregulated CD3+ T cells (B). C–I, Flow cytometry results from the draining lymph node from the in vivo experiment comparing OAD + HRT + FF (green) with CD + HRT + FF (blue) and CD + HRT (gray). Included gating: CD8+ T cells (C), CD4+ T cells (D), CD25+ FOXP3+ regulatory T cells (E), CD36+ regulatory T cells (F), and mTOR upregulated (p4EBP1 and pS6 ribosomal protein) regulatory T cells (G). Geometric MFI is shown for Tbet and IL10 expression on regulatory T cells (H–I). J–L, Flow cytometry results from the draining lymph node from the in vivo experiment comparing OAD + HRT + FF (green) with CD + HRT + FF (blue) and CD + HRT (gray). Included MFI of CD36 on CD8s (J), CD25+ CD8+ T cells (K), and granzyme B+ PD-1– CD8+ T cells (L). M–P, Flow cytometry results from the excised tumors from the in vivo experiment comparing OAD + HRT + FF (green) with CD + HRT + FF (blue) and CD + HRT (gray), including naïve CD44 CD62 L high CD8 T cells (J), MFI of Ki-67 on CD8 T cells (K), PD-L1+ alive cells (O), and PD-L1+ CD45-negative cells (P).