. 2024 Feb 16;30(9):1916–1933. doi: 10.1158/1078-0432.CCR-23-3433

Figure 6.

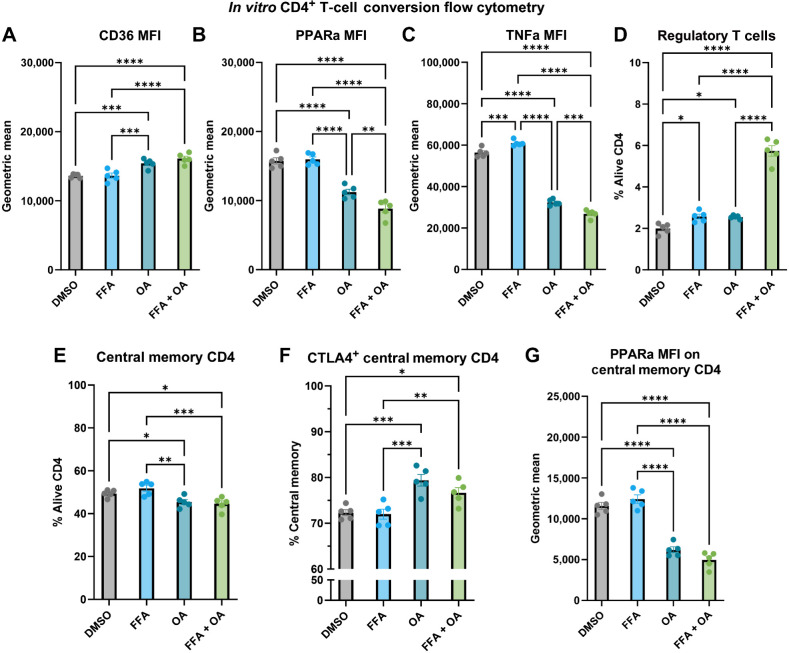
Figure 6. FF favors a Th1 phenotype whereas the addition of OA polarizes CD4 T cells to a Treg phenotype. A–C, Flow cytometry results of the CD4 conversion assay showing the MFI of CD36 (A), PPARα (B), and TNFα (C) as a geometric mean of the four groups: DMSO control (gray), 100 μmol/L FFA (blue), 100 μmol/L OA (teal), combination 100 μmol/L FFA + OA (light green). D–G, Flow cytometry results of the CD4 conversion assay showing the polarization of cells to FOXP3+ CD25+ regulatory T cells (D), CD44+ CD62 L high central memory CD4 T cells (E), CTLA4+ expressing central memory CD4 T cells (F), PPARα MFI on central memory CD4 T cells (G).

FF favors a Th1 phenotype whereas the addition of OA polarizes CD4 T cells to a Treg phenotype. A–C, Flow cytometry results of the CD4 conversion assay showing the MFI of CD36 (A), PPARα (B), and TNFα (C) as a geometric mean of the four groups: DMSO control (gray), 100 μmol/L FFA (blue), 100 μmol/L OA (teal), combination 100 μmol/L FFA + OA (light green). D–G, Flow cytometry results of the CD4 conversion assay showing the polarization of cells to FOXP3+ CD25+ regulatory T cells (D), CD44+ CD62 L high central memory CD4 T cells (E), CTLA4+ expressing central memory CD4 T cells (F), PPARα MFI on central memory CD4 T cells (G).