. 2024 Feb 6;14(5):766–785. doi: 10.1158/2159-8290.CD-23-0857

Figure 1.

Figure 1. Phase II trial results and sample collection schema. A, Sample collection schedule and analysis platforms in a phase II sequential chemoimmunotherapy trial. Circles correspond to samples included in analyses. B, Waterfall plot demonstrating RECISTv1.1 response for patients in the trial. C, Clinical trial patient composition and response rates by TCGA molecular subgroup. D, Kaplan–Meier curve showing progression-free survival (PFS) by fast and slow progressor categorization. Statistical comparison performed using a log-rank test. E, Kaplan–Meier curve showing overall survival (OS) by fast and slow progressor categorization. Statistical comparison performed using a log-rank test.

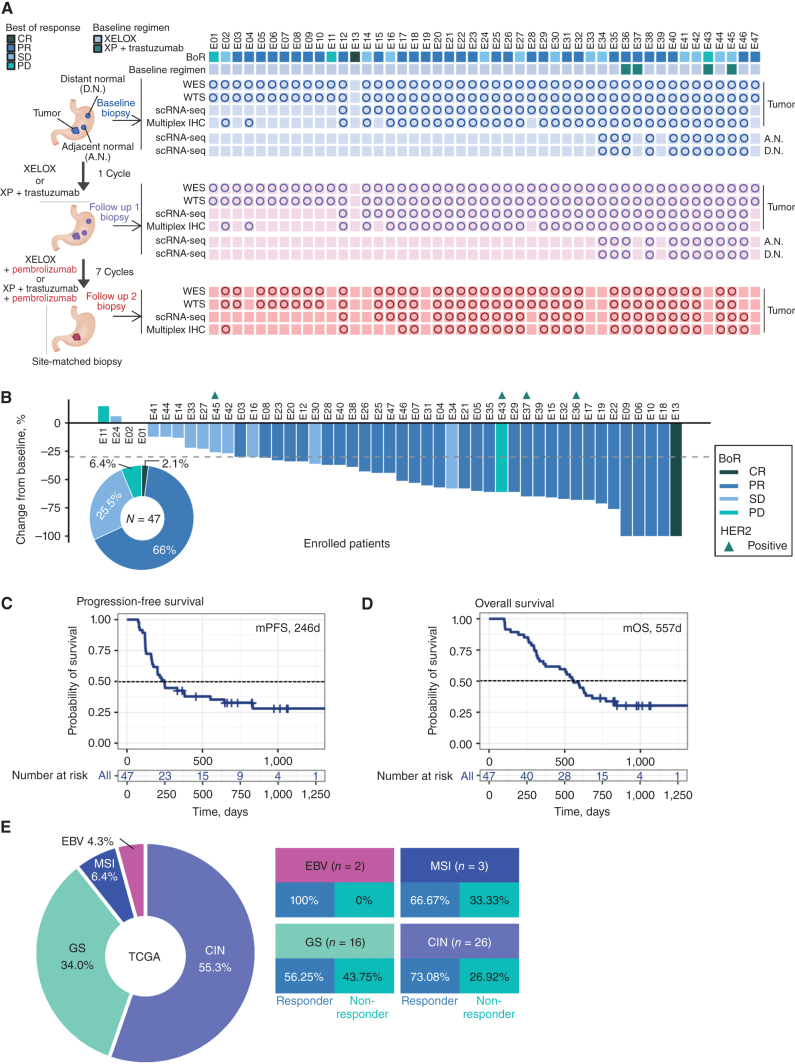
Phase II trial results and sample collection schema. A, Sample collection schedule and analysis platforms in a phase II sequential chemoimmunotherapy trial. Circles correspond to samples included in analyses. B, Waterfall plot demonstrating RECISTv1.1 response for patients in the trial. C, Clinical trial patient composition and response rates by TCGA molecular subgroup. D, Kaplan–Meier curve showing progression-free survival (PFS) by fast and slow progressor categorization. Statistical comparison performed using a log-rank test. E, Kaplan–Meier curve showing overall survival (OS) by fast and slow progressor categorization. Statistical comparison performed using a log-rank test.