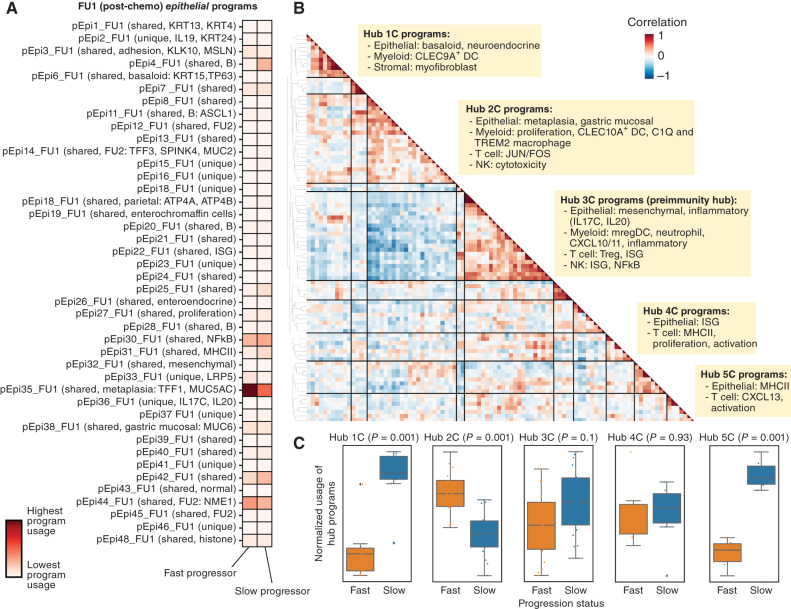
Figure 3.
Identification of covarying gene programs that underlie chemotherapy resistance and response. A, cNMF was performed on epithelial cells at FU1. Shown is the mean usage of each cNMF gene program in the epithelial cells of fast and slow progressing patients. B, Heat map showing pairwise correlation of gene program activities across all patient samples at FU1 using the 90th percentile of patient-level program activity in epithelial, myeloid, T, NK, and stromal cells. Hierarchical clustering was performed to identify clusters of covarying proteins, which have been labeled as Hub1C to 5C. C, Average z-scored usage of all gene programs in each hub split by fast and slow progressing patients. Statistical comparison performed using a two-sample t test with Bonferroni correction.

