. 2024 Mar 8;14(5):846–865. doi: 10.1158/2159-8290.CD-23-0388

Figure 1.

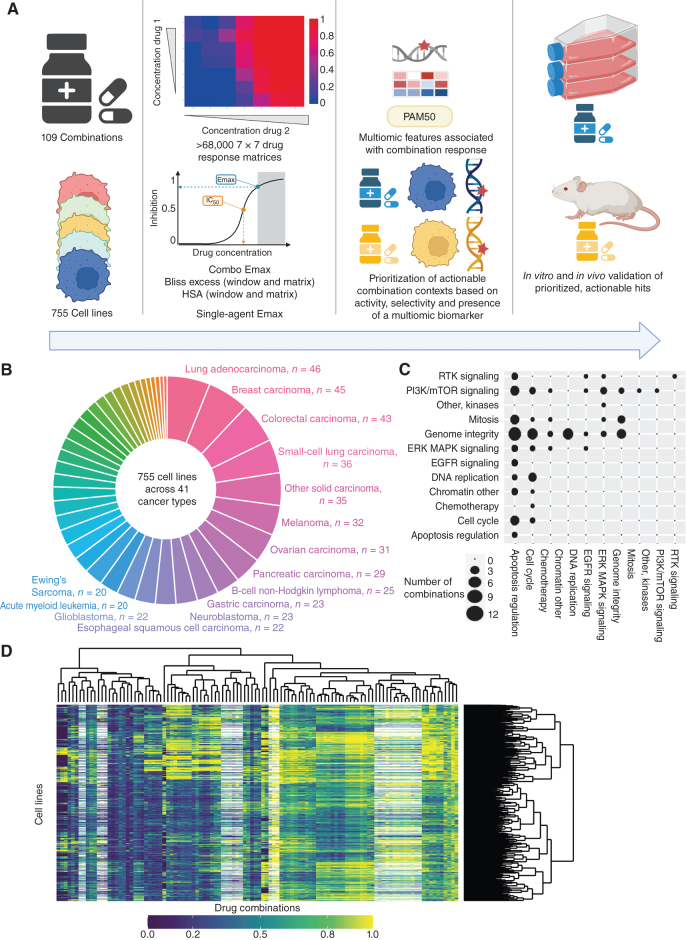
Figure 1. Dose response matrix combination screening landscape. A, Schematic of screen and analysis. Created with BioRender. B, Overview of cell line cancer types. C, Drug combinations screened grouped by drug target pathways. D, Combo Emax for 755 cell lines screened with 109 combinations. White represents combination/cell line pairs not screened.

Dose response matrix combination screening landscape. A, Schematic of screen and analysis. Created with BioRender.com. B, Overview of cell line cancer types. C, Drug combinations screened grouped by drug target pathways. D, Combo Emax for 755 cell lines screened with 109 combinations. White represents combination/cell line pairs not screened.