. 2024 Mar 8;14(5):846–865. doi: 10.1158/2159-8290.CD-23-0388

Figure 2.

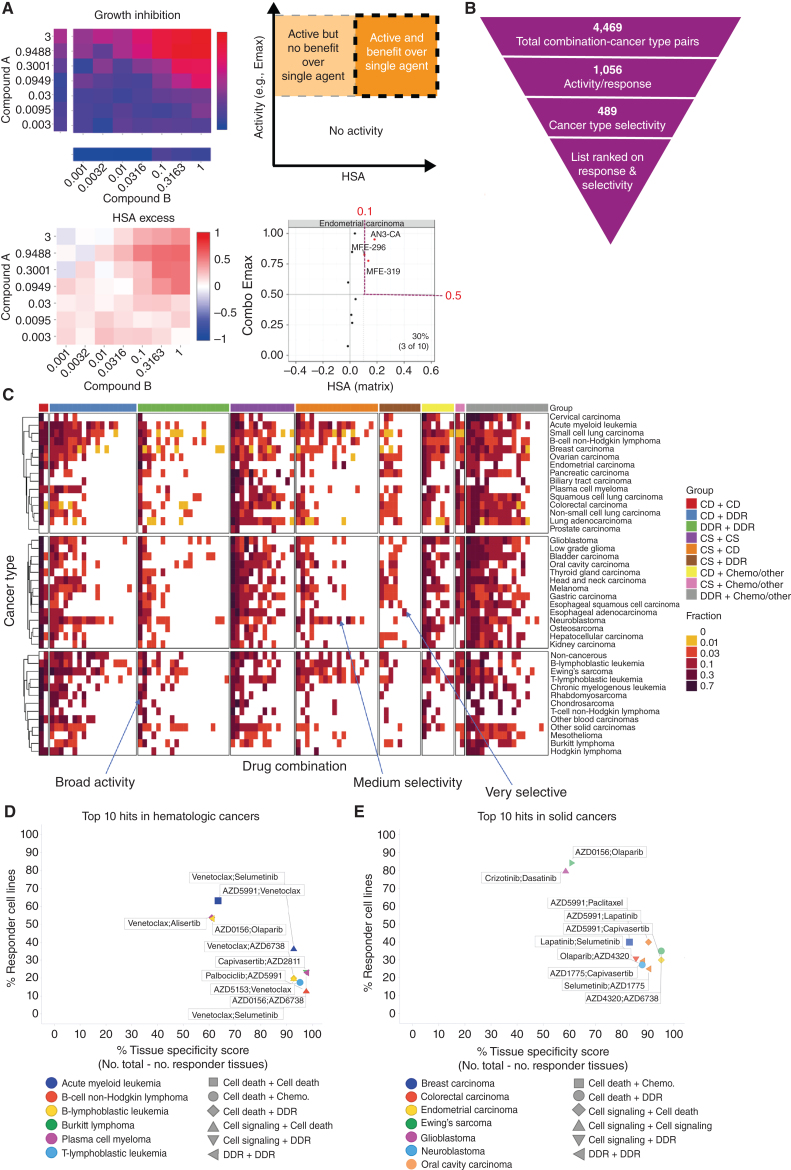
Figure 2. Shortlisting for active and selective combinations. A, Growth inhibition (Emax) and HSA matrix plots were generated for each combination in every cell line. Combo Emax and HSA were used to identify active combinations with benefit over single agent (s.a.). B, Combinations were filtered on the basis of their activity and selectivity in the tested cancer types. C, Activity of each combination tested in this screen in 41 cancer types. The fraction of cell lines where the combinations are active is indicated and combinations are grouped by category. D and E, Top 10 hits in hematologic cancers (D) and solid tumors (E). Percentage of responder cell lines for each combination in each cancer type plotted versus cancer-type specificity scores. Each color represents a cancer type and combination categories are represented by different shapes. CD, cell death; DDR, DNA damage response; CS, cell signaling; chemo, chemotherapeutic agents.

Shortlisting for active and selective combinations. A, Growth inhibition (Emax) and HSA matrix plots were generated for each combination in every cell line. Combo Emax and HSA were used to identify active combinations with benefit over single agent. B, Combinations were filtered on the basis of their activity and selectivity in the tested cancer types. C, Activity of each combination tested in this screen in 41 cancer types. The fraction of cell lines where the combinations are active is indicated and combinations are grouped by category. D and E, Top 10 hits in hematologic cancers (D) and solid tumors (E). Percentage of responder cell lines for each combination in each cancer type plotted versus cancer-type specificity scores. Each color represents a cancer type and combination categories are represented by different shapes. CD, cell death; DDR, DNA damage response; CS, cell signaling; chemo, chemotherapeutic agents.