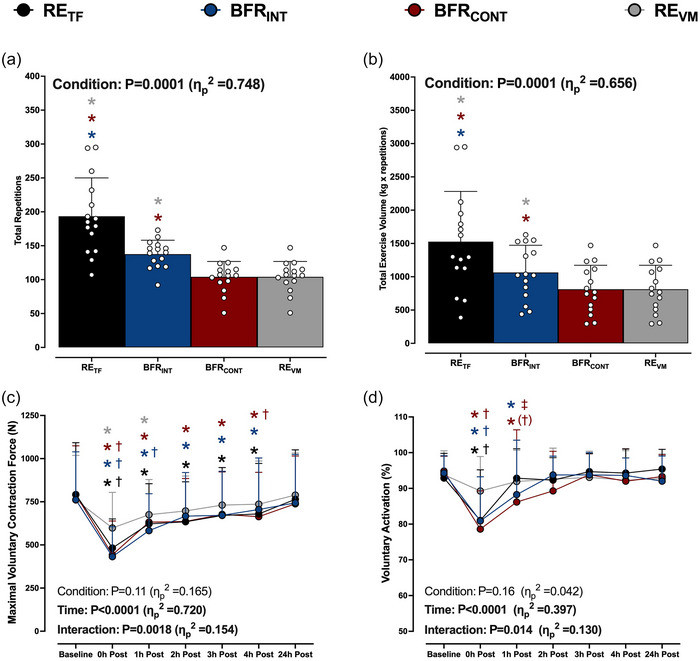
FIGURE 2.

(a, b) Total exercise repetitions (a) and volume (repetitions × load; b) performed after the six sets for low‐load resistance exercise to task failure (RETF; black bars or circles), low‐load resistance exercise to task failure with BFR applied intermittently during exercise sets (BFRINT; blue bars or circles), low‐load resistance exercise to task failure with BFR applied continuously (BFRCONT; maroon bars or circles), and low‐load resistance exercise volume matched (REVM; grey bars or circles) to the condition with the lowest total number of repetitions. The colour of each asterisk represents the condition that is significantly different from RETF or BFRINT. Data are expressed as means + standard deviation with the white circles representing individual participants (n = 15/condition). (c, d) Maximum voluntary contraction force (c) and voluntary activation (d) at baseline and during the 0–24 h recovery period after each condition. ANOVA P‐values with partial eta (ηp 2) are provided in each panel. Data are expressed as means + standard deviation (n = 14/condition). *P < 0.05 versus baseline; †P < 0.05 versus REVM at the same time point; (†)P = 0.062 versus REVM at the same time point; ‡P < 0.05 versus RETF at the same time point. The colour of each symbol represents significantly different conditions. All individual responses can be found in the Supporting information.
