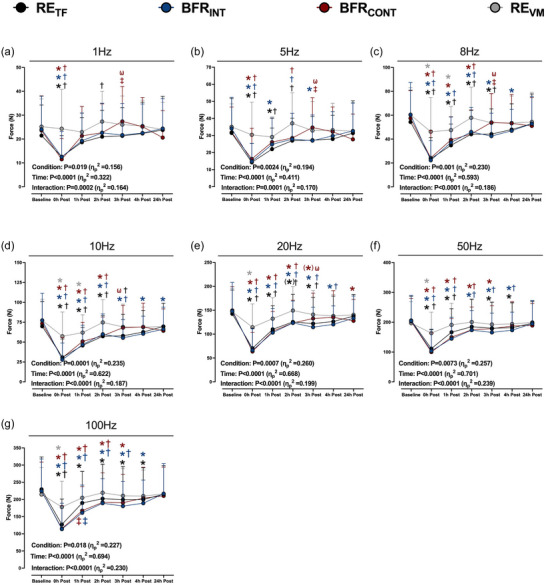
FIGURE 4.

Peak absolute force output at 1 Hz (a), 5 Hz (b), 8 Hz (c), 10 Hz (d), 20 Hz (e), 50 Hz (f), and 100 Hz (g) of stimulation delivered over 1 s at baseline and 0–24 h after six sets of low‐load resistance exercise to task failure (RETF; black circles), low‐load resistance exercise to task failure with BFR applied intermittently during exercise sets (BFRINT; blue circles), low‐load resistance exercise to task failure with BFR applied continuously (BFRCONT; maroon circles), and low‐load resistance exercise volume matched (REVM; grey circles) to the condition with the lowest total number of repetitions. ANOVA P‐values with partial eta (ηp 2) are provided in each panel. *P < 0.05 versus baseline; (*)P = 0.062 versus baseline; †P < 0.05 versus REVM at the same time point; ‡P < 0.05 versus RETF at the same time point; ωP < 0.05 versus BFRINT at the same time point. The colour of each symbol represents a significantly different condition. Data are expressed as means + standard deviation (n = 15/condition). All individual responses can be found in the Supporting information.
