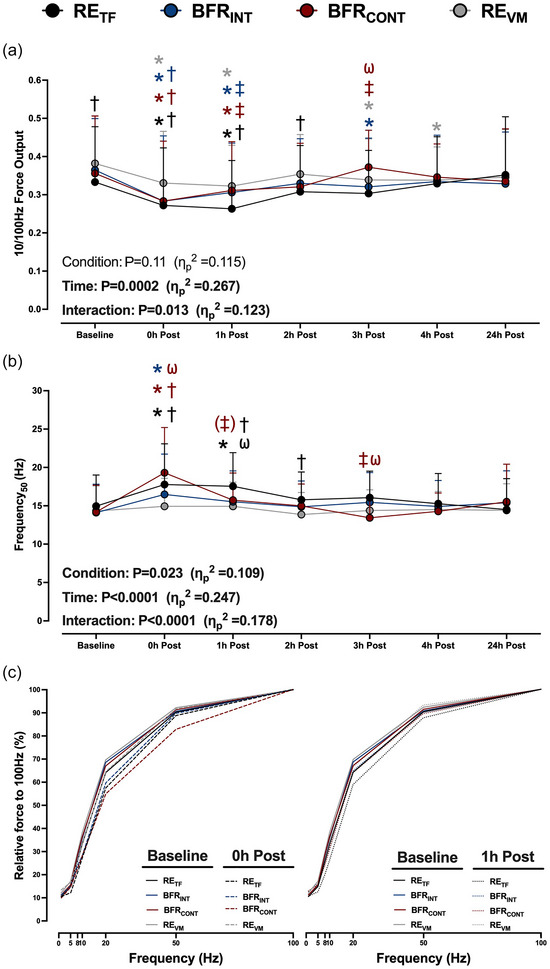
FIGURE 5.

(a, b) The time course recovery of the 10/100 Hz force output (a) and the frequency required to elicit 50% of the force at 100 Hz (Frequency50; b) after six sets of low‐load resistance exercise to task failure (RETF; black lines and circles), low‐load resistance exercise to task failure with BFR applied intermittently during exercise sets (BFRINT; blue lines and circles), low‐load resistance exercise to task failure with BFR applied continuously (BFRCONT; maroon lines and circles), and low‐load resistance exercise volume matched (REVM; grey lines and circles) to the condition with the lowest total number of repetitions. The Frequency50 was determined using non‐linear regression analysis. ANOVA P‐values with partial eta (ηp 2) are provided. (c) Relative force–frequency curves to illustrate the rightward shift 0 h post‐exercise (dashed lines) and 1 h post‐exercise (dotted lines) compared to baseline (continuous lines). Symbols and error bars are omitted for clarity. The mean values and the variance of the relative force output for each frequency can be found in Table 2. *P < 0.05 versus baseline; †P < 0.05 versus REVM at the same time point; ‡P < 0.05 versus RETF at the same time point; (‡)P = 0.063 versus RETF at the same time point; ωP < 0.05 versus BFRINT at the same time point. The colour of each symbol represents a significantly different condition. Data are expressed as means + standard deviation (n = 15/condition). All individual responses can be found in the Supporting information.
