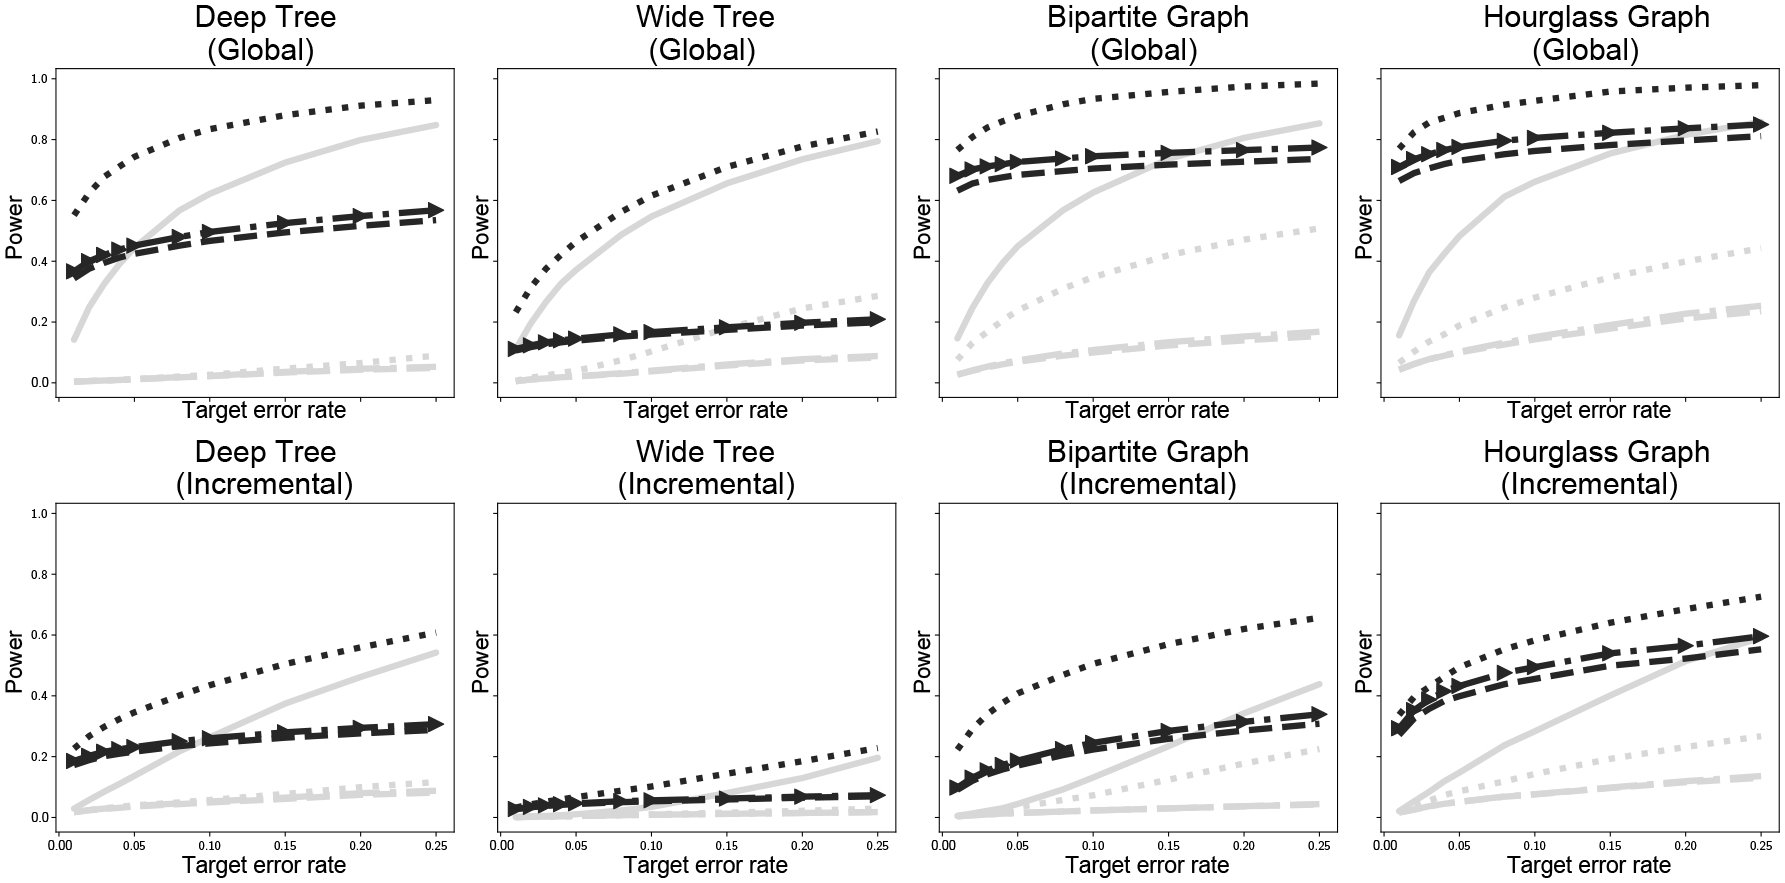
Fig. 1:

Empirical power in each simulation as a function of target error rate. Gray lines are unsmoothed results, black lines are smoothed results; dashed lines use Meijer & Goeman (2015), dashed lines with arrows use Meijer & Goeman (2015) with Algorithm 3, and dotted lines use Ramdas et al. (2019a); the solid gray line is the structureless method of Benjamini & Hochberg (1995).
