
Fig. 3:
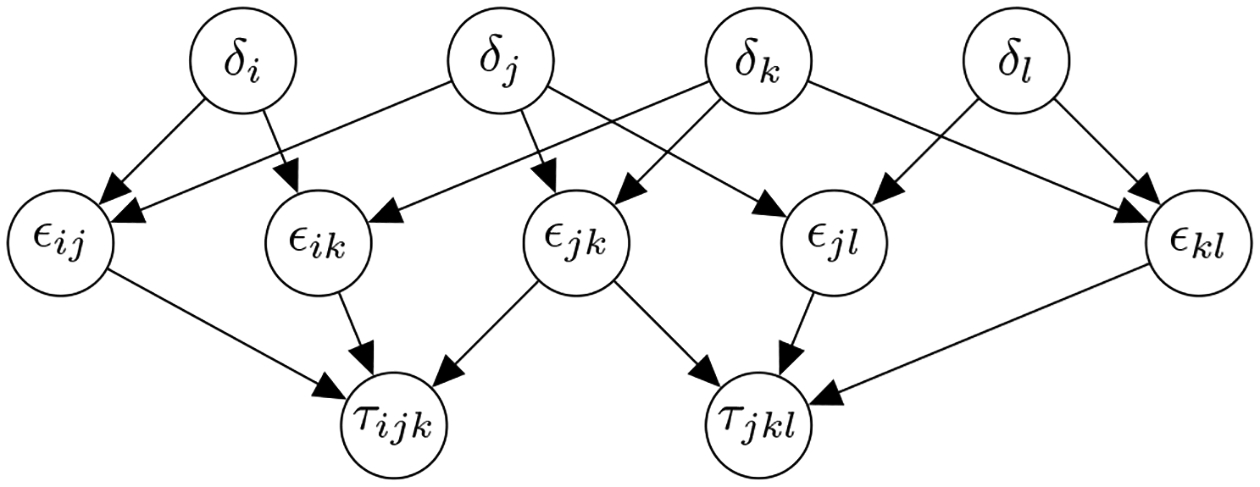
Example directed acyclic graph for the genetic interaction study. Individual gene knockouts s are the top of the graph, pair knockouts are in the middle, and triplet knockouts are the leaves. Each node corresponds to an experiment conducted independently and has an independent -value. If any set of genes potentially contributes to synthetic lethality, the null hypothesis at that node is rejected; all subsets must implicitly be rejected as well.