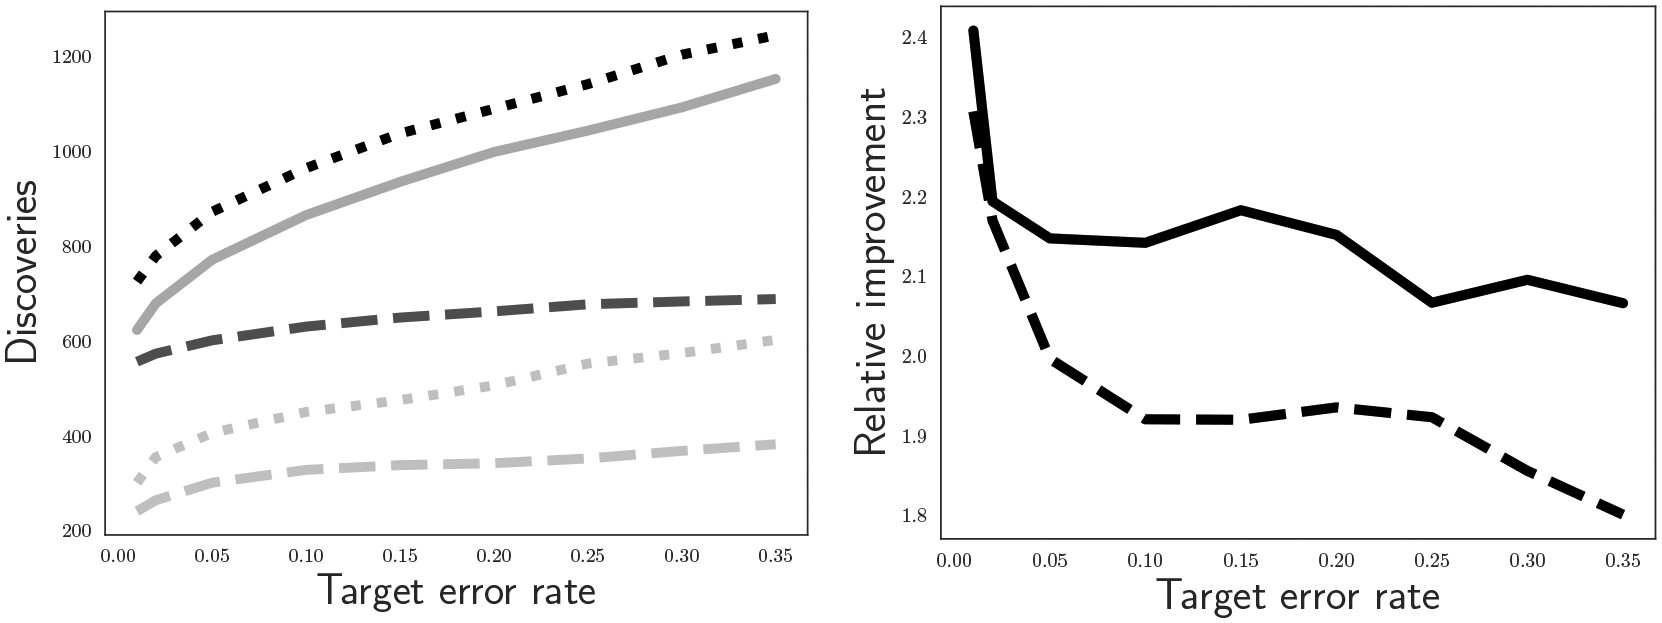
Fig. 4:

Performance comparison of raw -values versus smoothed -values on a biological dataset. Left: total discoveries reported by each method at varying error rates. Solid gray line: Benjamini & Hochberg (1995); dotted black line: Fisher smoothing with the Ramdas et al. (2019a) method, dashed dark gray line: Fisher smoothing with the method of Meijer & Goeman (2015); light gray lines at bottom are the same two methods without smoothing. Right: relative gain of using smoothed -values over raw -values. Solid black line: relative improvement for the Ramdas et al. (2019a) method; dashed black line: relative improvement for the method of Meijer & Goeman (2015).
