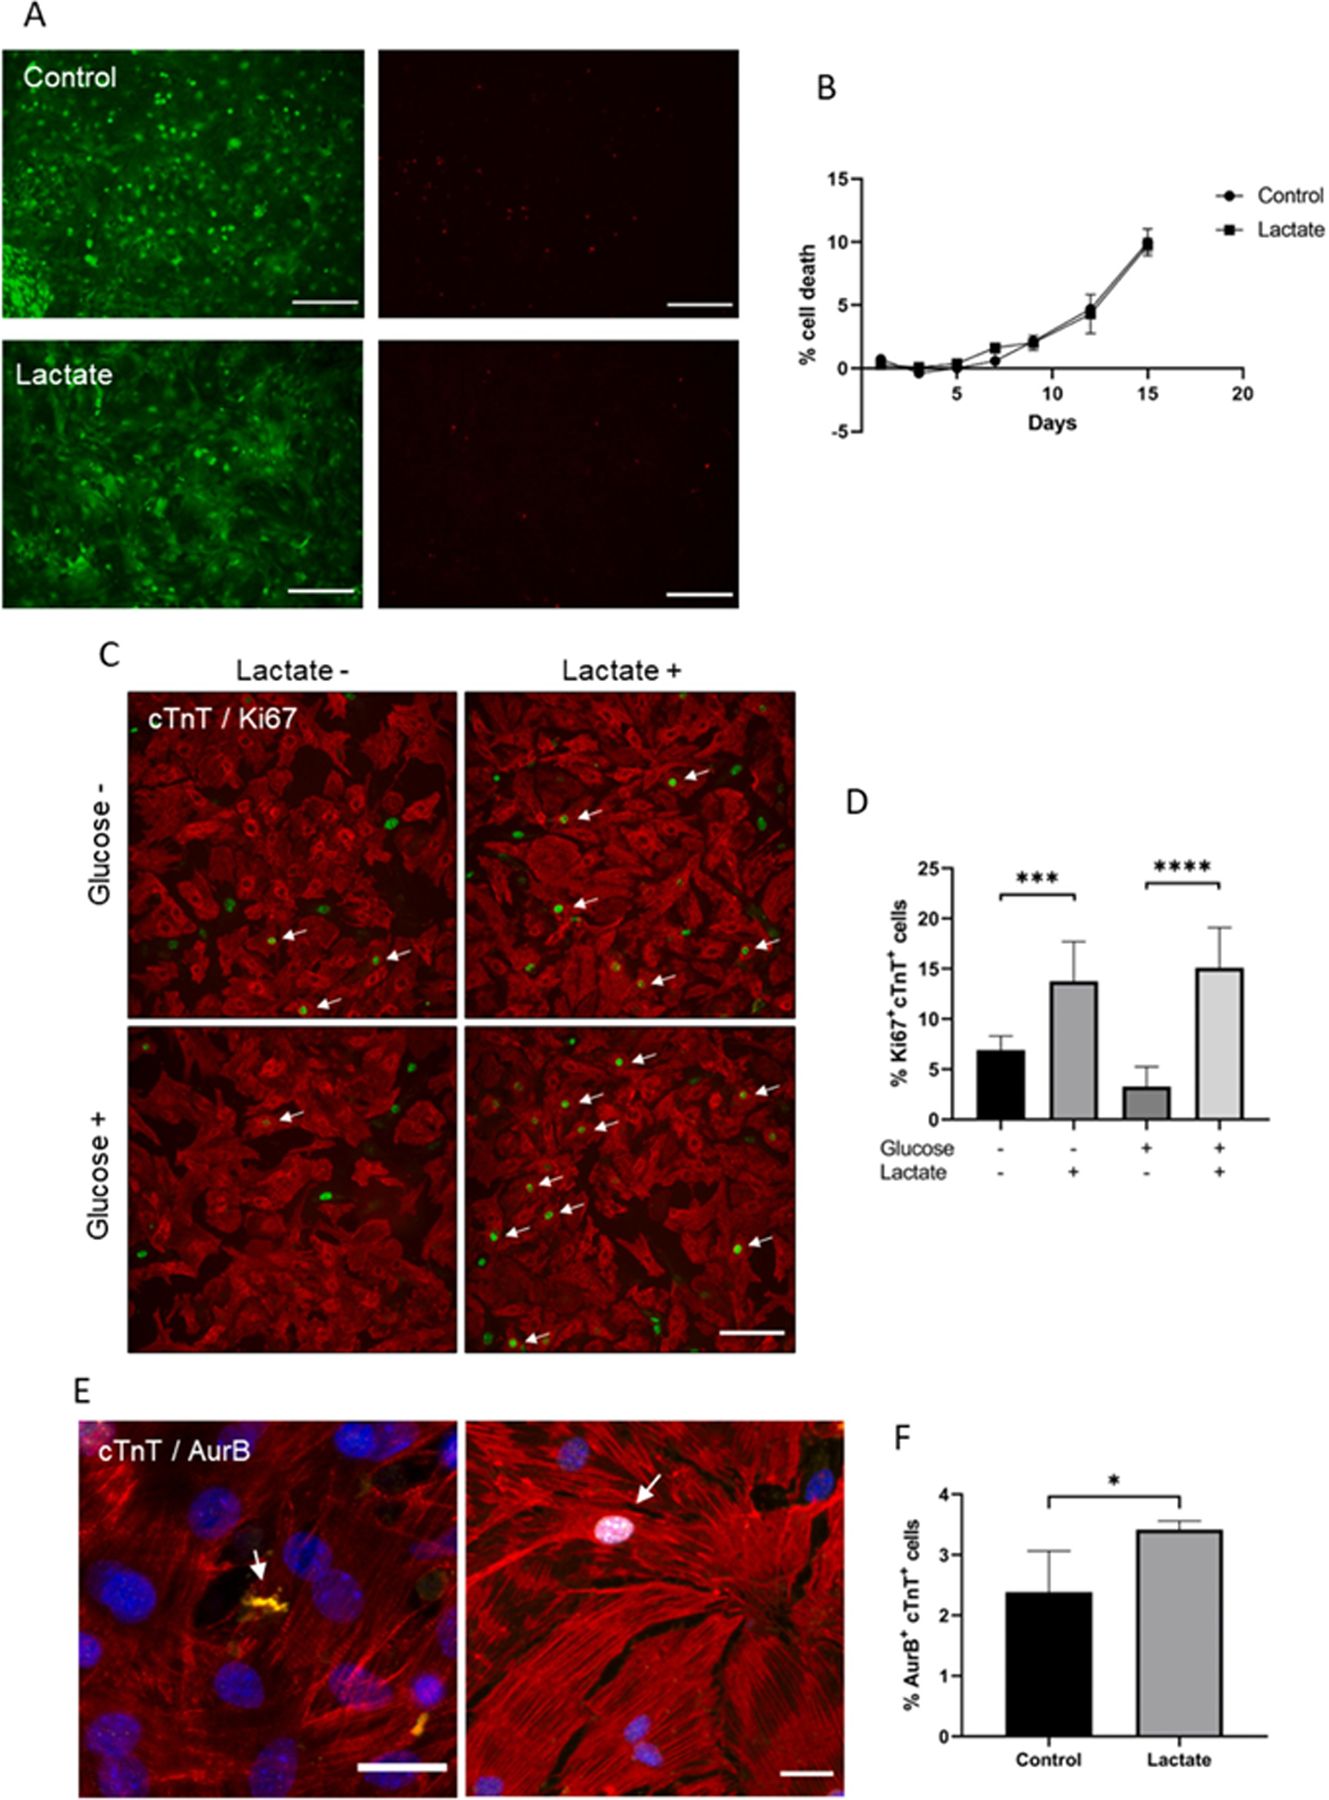
Fig. 1. Effect of lactate on mouse cardiomyocyte cell cycle activity.

(A) Live/dead assay of cardiomyocytes after 7 days of incubation with 0 or 20 mM of lactate. Green (left) and red (right) channels showing alive and death cells respectively; scale bar: 200 μm. (B) LDH detection on culture media of cardiomyocytes incubated with 0 or 20 mM of lactate. Data are expressed as % of cell death compared to maximum LDH released by lysed cells (100 %). n = 3. (C) Ki67 immunostaining on cardiac cells after 3 days of culture with (+) or without (−) lactate. In this case, glucose-containing (Glucose +) and glucose-depleted (Glucose -) cell culture media was used. Red: cardiac Troponin T (cTnT), green: Ki67. Only Ki67+cTnT+ cells (white arrows) were quantified; scale bar: 100 μm. (D) Quantification of Ki67+cTnT+ cells after 3 days of culture with (+) or without (−) lactate in glucose-containing (Glucose +) or glucose-depleted (Glucose -) cell culture media. Data are represented as % of Ki67+cTnT+ cells to the total number of cTnT+ cells. Results are from 3 independent cell cultures and around 1200 cardiomyocytes were analyzed for each group. One-way ANOVA, ***p < 0.001, ****p < 0.0001. (E) Aurora-B kinase immunostaining on mouse cardiomyocytes. White arrows indicate AurB+cTnT+ cells. Yellow: AurB, red: cTnT, blue: nuclei; scale bar: 25 μm. (F) Quantification of AurB-positive cardiomyocytes after 10 days of culture with 20 mM of lactate supplemented into glucose-containing cell media. Data are represented as % of AurB+cTnT+ to the total number of cTnT+ cells. Results are from 4 independent cell cultures and around 4000 cardiomyocytes were analyzed for each group. Student’s t-test, *p < 0.05.
