
Fig. 3. Effect of lactate on cardiac fibroblasts.
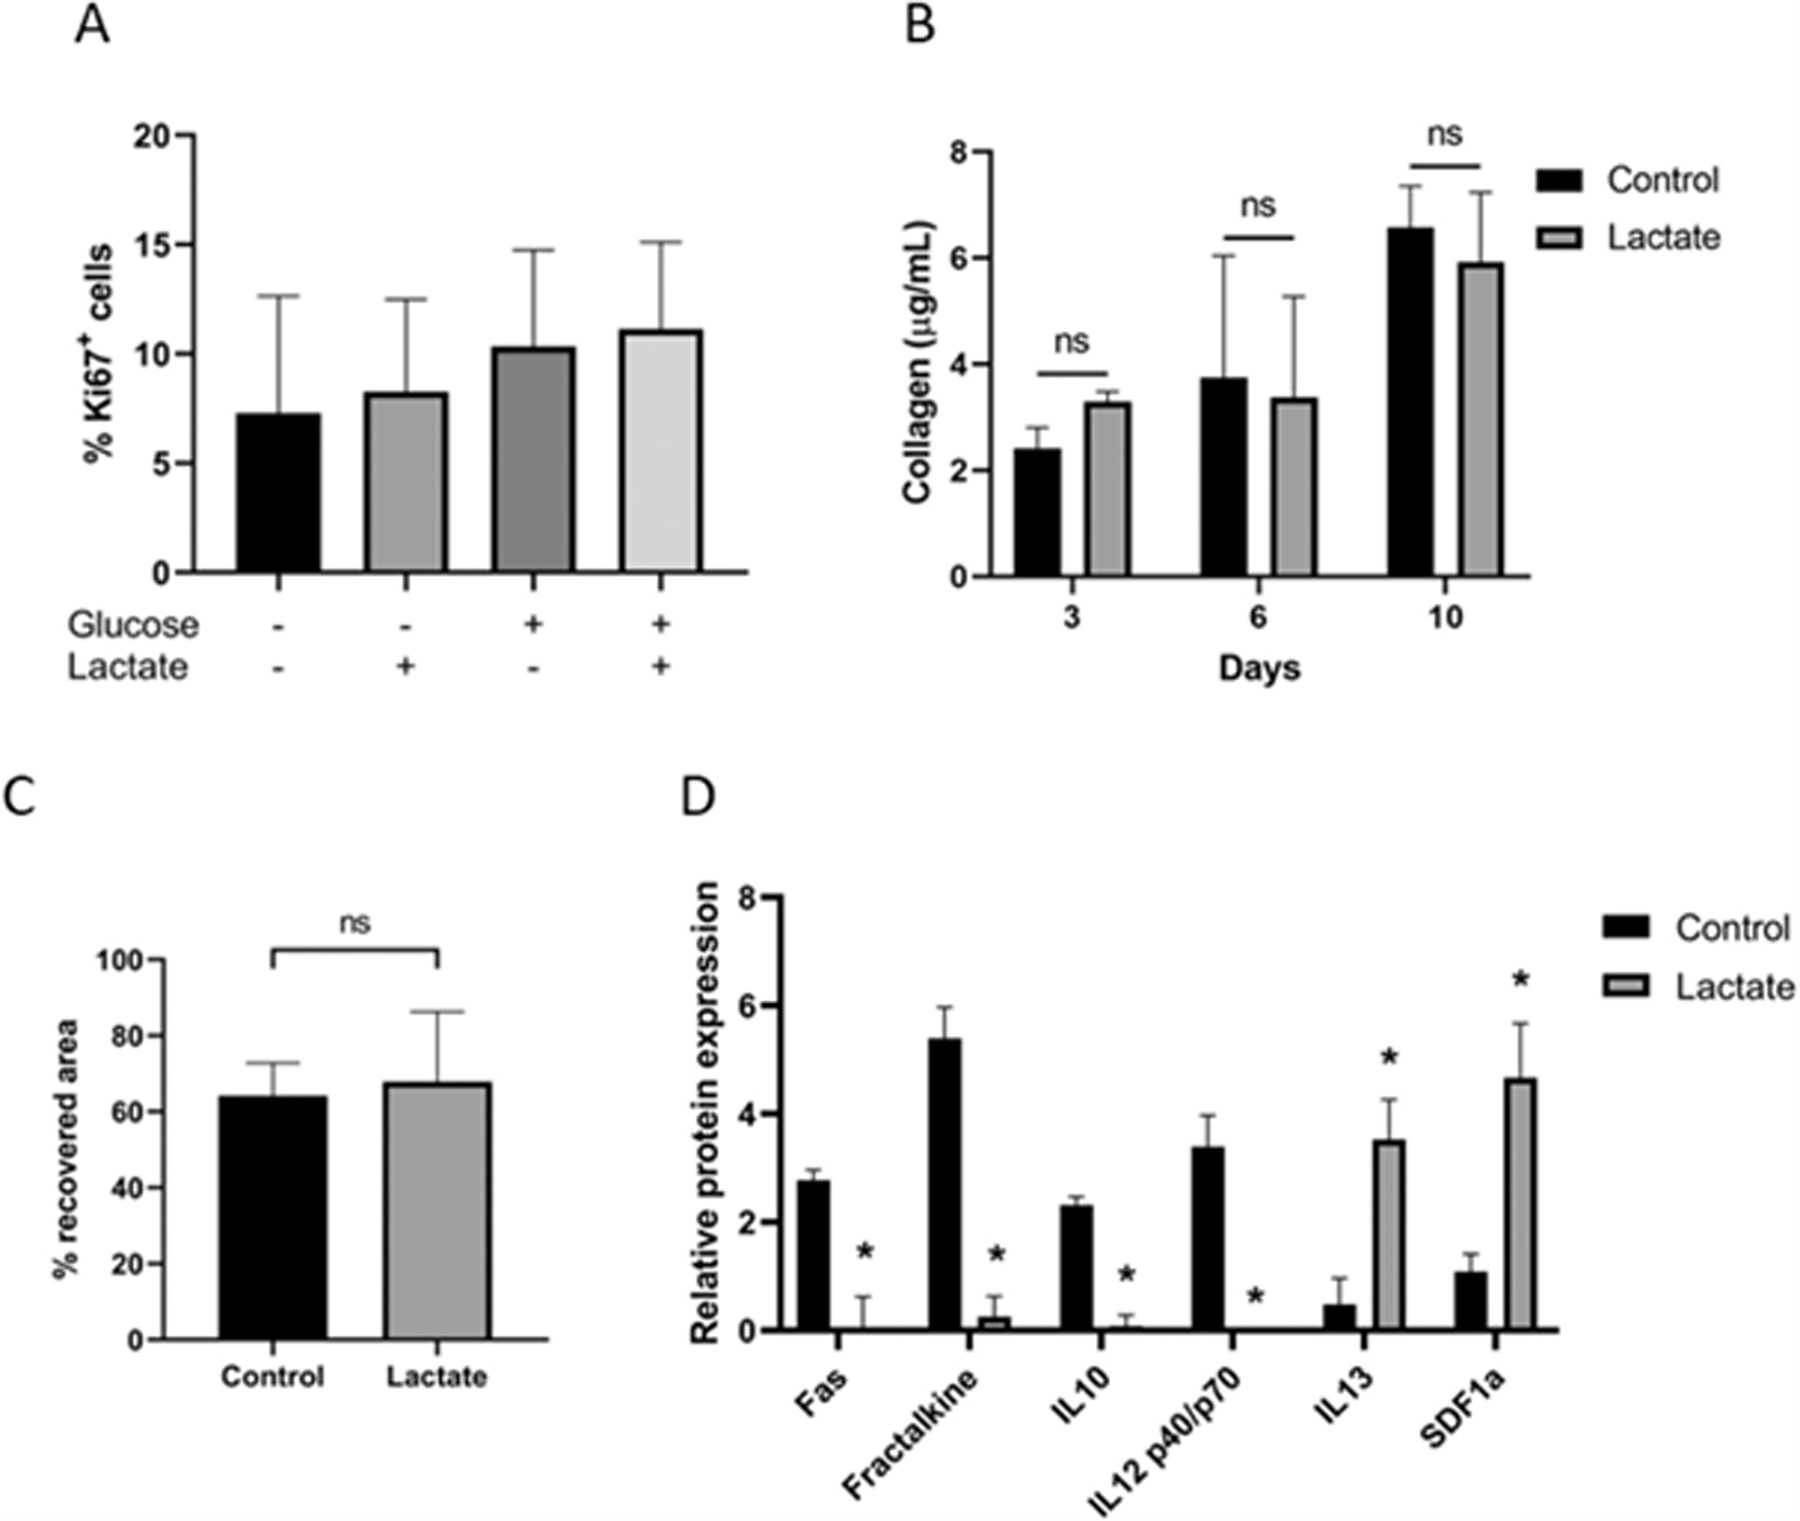
(A) Quantification of Ki67-positive cells after 3 days of culture with (+) or without (−) lactate in glucose-containing (+) and glucose-depleted (−) cell culture media. Data were analyzed using a one-way ANOVA and represented as % of Ki67+ cells to the total number of cells. Results are from 3 independent cell cultures and at least 214 Ki67+ cells were counted per group. (B) Quantification of total collagen content on cardiac fibroblasts after 3, 6 and 10 days of culture with 0 or 20 mM of lactate. Data were analyzed with a two-way ANOVA, ns: not significant; n = 2. (C) Wound closure of cells cultured with 0 or 20 mM of lactate. Data were measured as % of recovered area after 24 h of scratching and analyzed with a Student’s t-test. Results are from 8 different regions from 2 independent cell cultures. (D) Quantification of inflammatory cytokines (only significant differences are shown, see also Sup. Table 1). Signal expression of each sample was calibrated according to total protein. Internal positive (100) and negative controls (0) were used to generate numerical values of each sample. Results are from 2 independent experiments performed on different days. Student’s t-test of lactate compared to control condition, *p < 0.05.