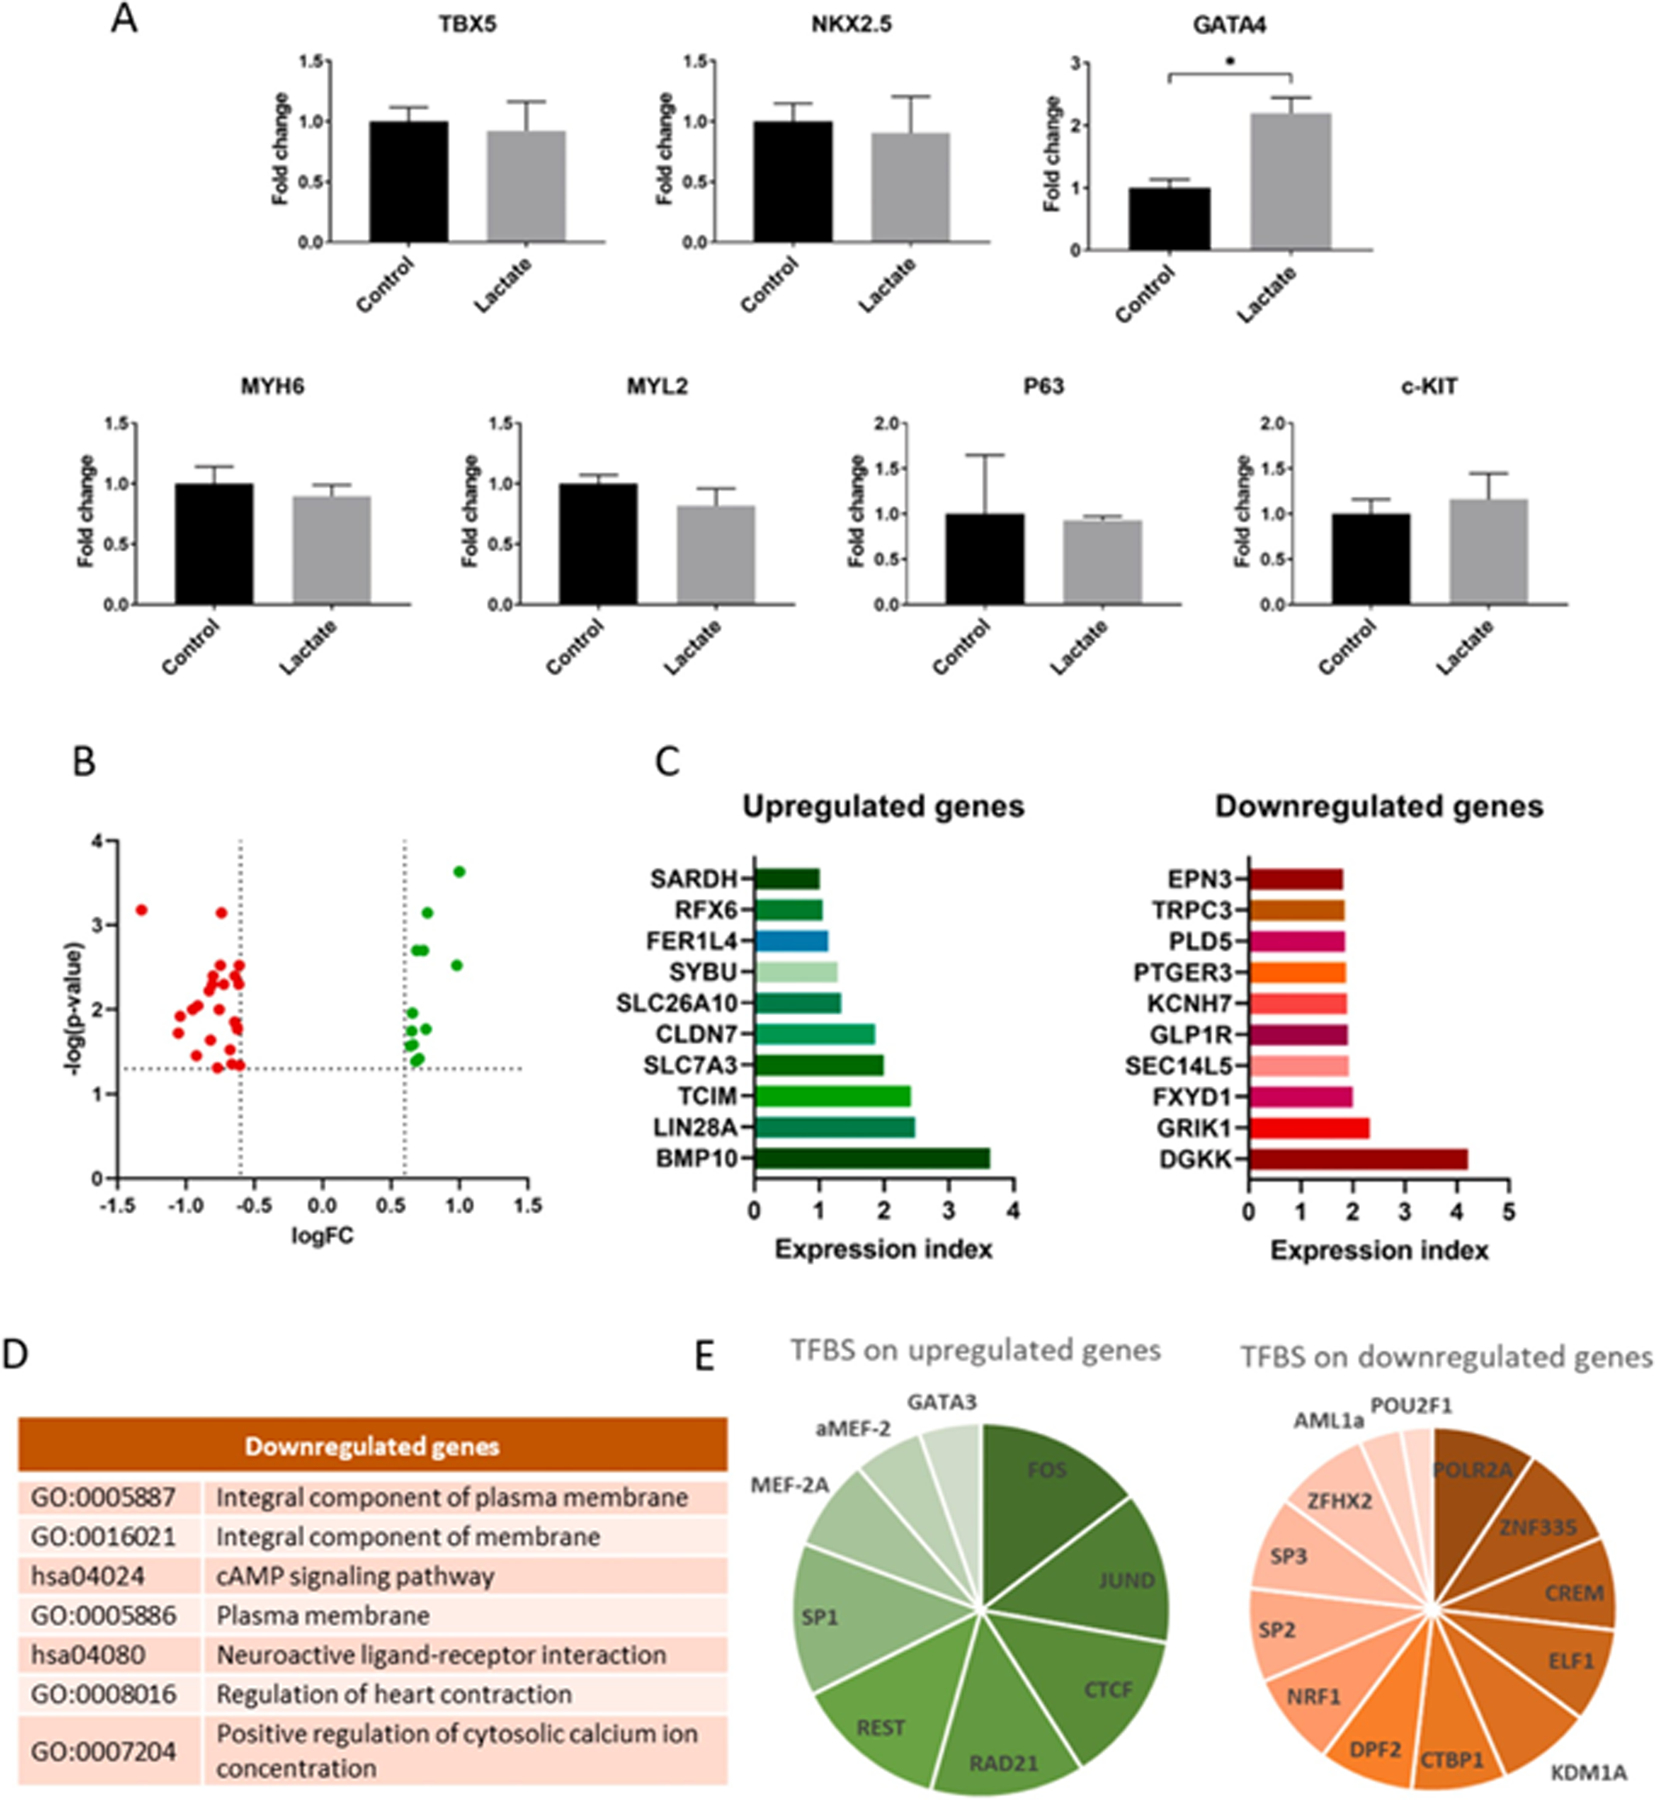
Fig. 5. Gene expression and transcriptome analysis of hiPSC-CM.

(A) Relative gene expression of cardiomyocytes cultured with 0 or 6 mM of lactate for 3 days. Results are from 3 independent cell cultures and data were analyzed using a student’s t-test, *p < 0.05. (B) Volcano plot showing differentially expressed (DE) genes from transcriptome sequencing from cardiomyocytes cultured with 0 or 6 mM of lactate during 7 days. Dashed lines represent DE thresholds used (0.6 log fold change cutoff and 0.05 p-value). Green: upregulated genes; red: downregulated genes; FC: fold change. (C) Top 10 up- and downregulated DE genes according to the expression index, the product of log(p-value) and logFC. (D) Gene ontologies (GO) and KEGG pathways associated to top downregulated genes (DAVID database, p < 0.05). (E) Summary of common transcription factors binding sites (TFBS) found on upregulated and downregulated genes, according to the number of genes in which the TFBS is found. All upregulated DE genes were used for the analysis, while only top downregulated genes were used. Data obtained from GeneCards® database. See also Sup.Tables 3 and 4.
