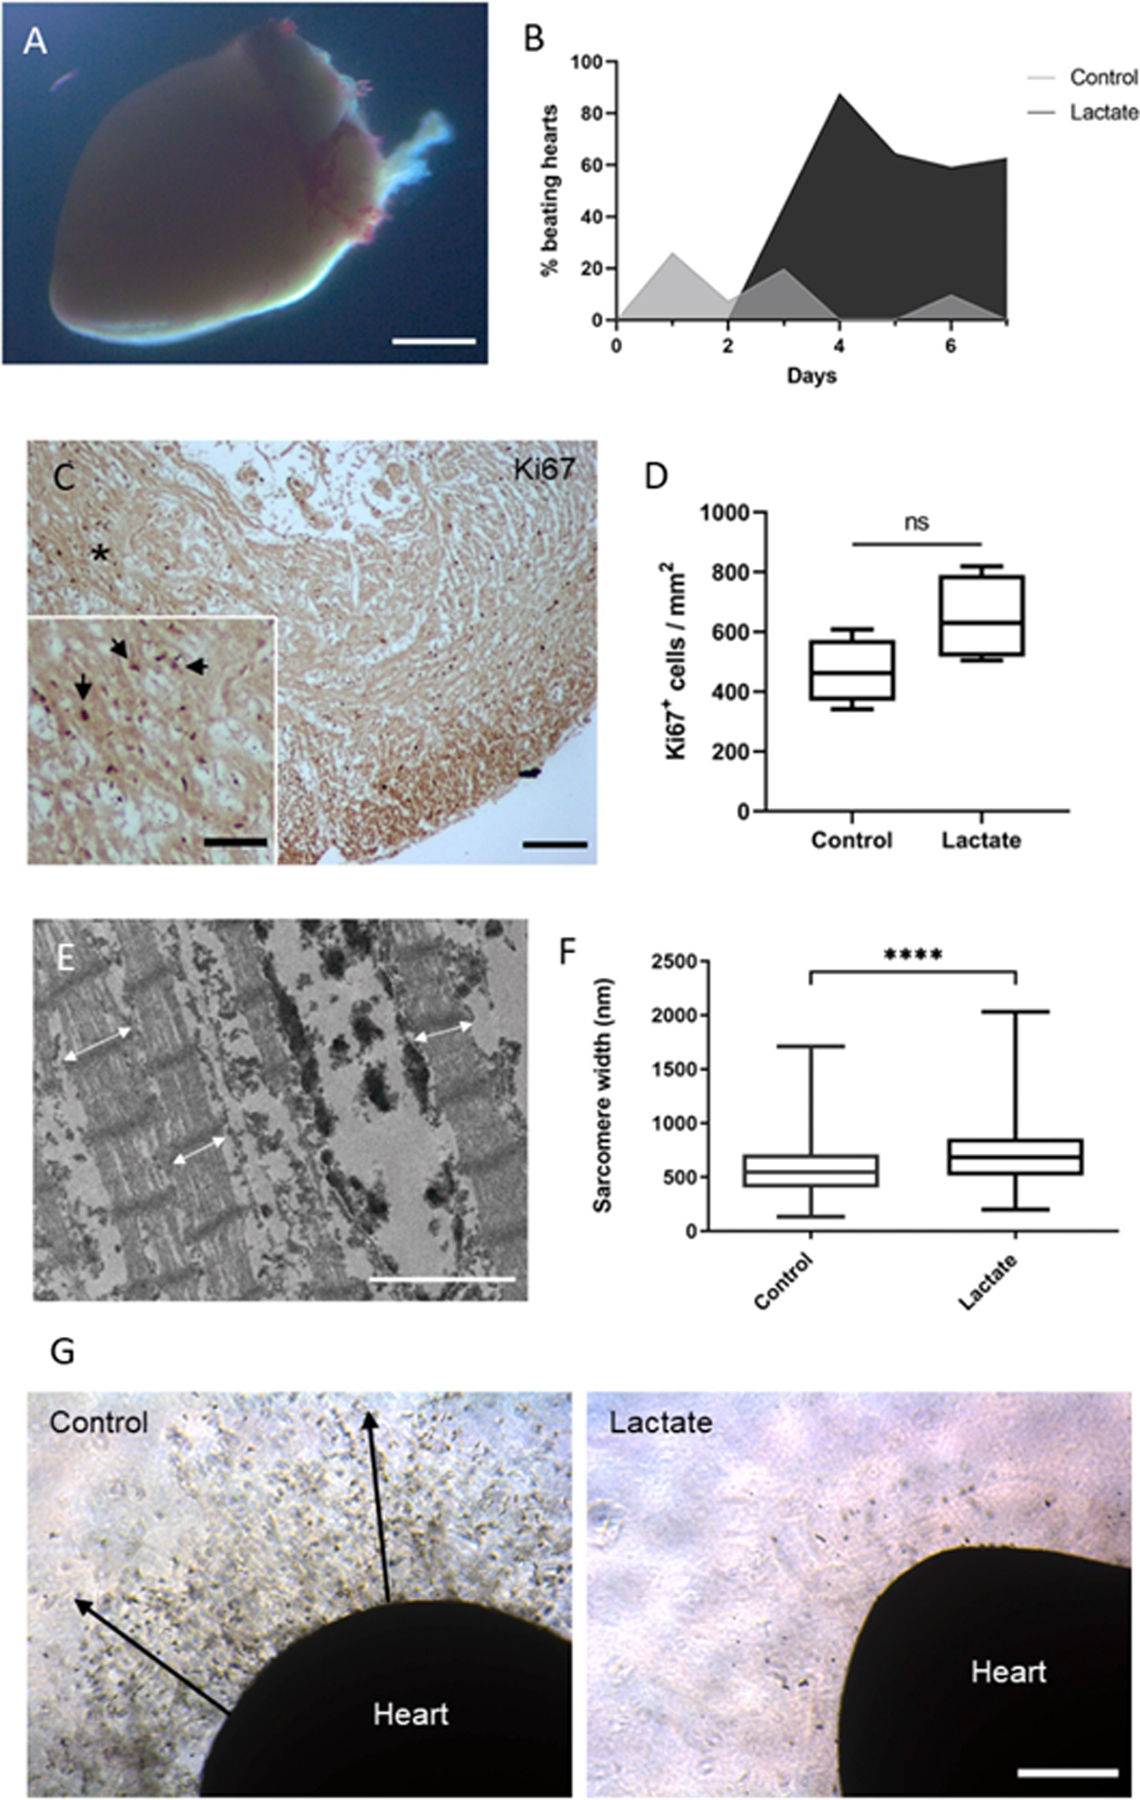
Fig. 6. Ex vivo heart culture.

(A) Stereomicroscope image of a cultured neonatal mouse heart embedded in Matrigel® matrix. Scale bar: 1 mm. (B) Fraction of ex vivo hearts showing spontaneous contraction (beating) activity at any region of the organ. 50 neonatal mouse hearts were evaluated. (C) Immunohistochemistry staining of Ki67 on a cross-section of a neonatal mouse heart cultured ex vivo for 9 days. Black arrows indicate positive Ki67 nuclei on a higher magnification image of the (*) region. Scale bar: 100 μm and 50 μm (magnification). (D) Quantification of Ki67-positive cells on tissue sections from ex vivo hearts incubated with 0 or 20 mM of lactate for 9 days. Data were analyzed using a student’s t-test, ns: non-significant, p = 0.097, n = 4 hearts. (E) Transmission electron microscopy image of a cardiac tissue section from an ex vivo cultured heart after 4 days. White arrows indicate sarcomere width. Scale bar: 2 μm. (F) Quantification of sarcomere width from ex vivo hearts incubated with 0 or 20 mM of lactate for 4 days. Data were analyzed with a student’s t-test with Welch’s correction, ****p < 0.0001. n = 4 hearts, and over 800 sarcomeres were measured per group. (G) Optical microscopy images of ex vivo hearts cultured with 0 or 20 mM of lactate for 9 days. Heart cells spread to the surrounding matrix on control hearts (black arrows). Scale bar: 400 μm.
