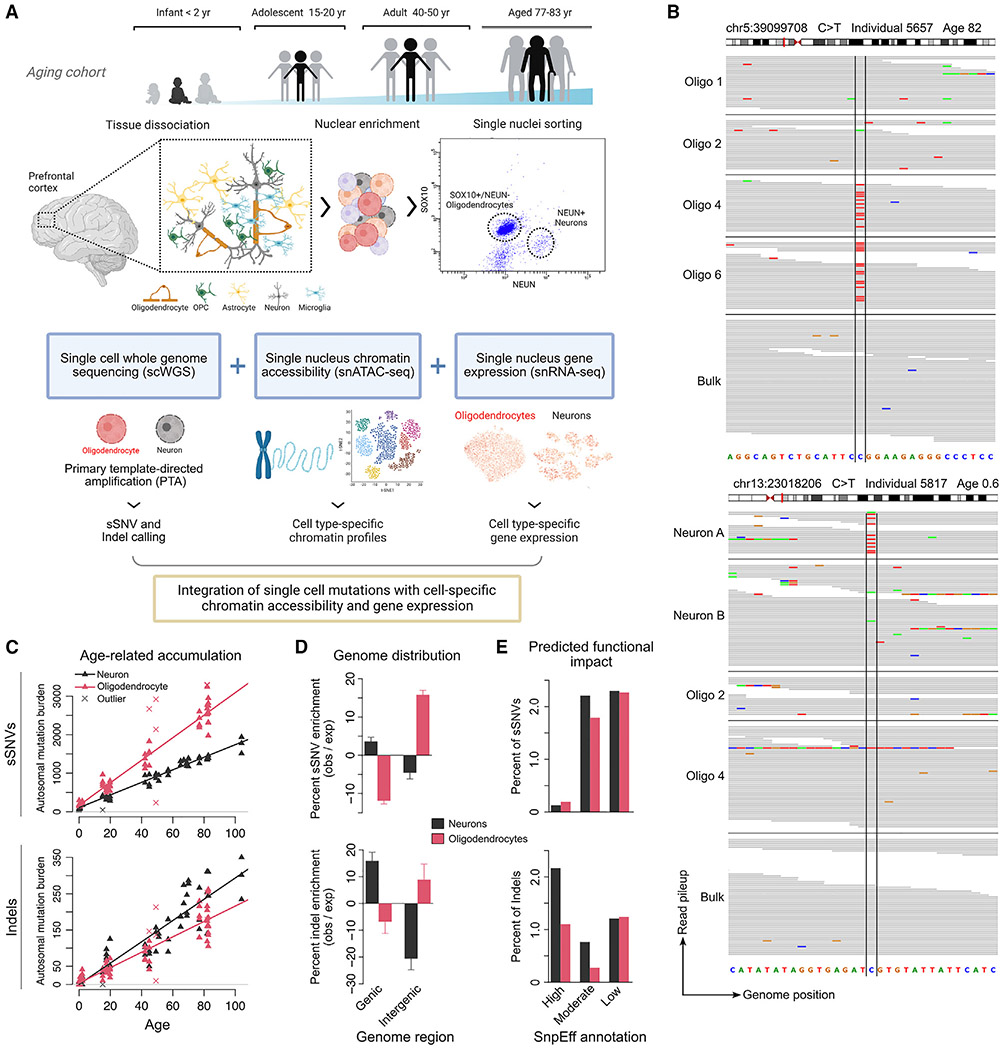
Figure 1. Somatic mutations in neurons and oligodendrocytes accumulate at different rates and in different genomic regions.
(A) Experimental strategy. Oligodendrocytes (OL; n = 66 PTA, n = 20 MDA) and neurons (n = 56 PTA) were obtained from the brains of 20 neurotypical individuals (0–104 years of age) through FANS using NEUN (neurons) and SOX10 (OL) antibodies. Single genomes were amplified using PTA or MDA and non-clonal somatic SNVs (sSNVs) and indels were called using SCAN2. Mutation distributions were compared with snATAC-seq and snRNA-seq data obtained from a subset of the 20 individuals.
(B) Integrated Genomics Viewer screenshots of two sSNVs identified by SCAN2. Top, an sSNV shared by two oligodendrocytes; bottom, a private sSNV in a neuron.
(C) Extrapolated genome-wide sSNV and indel burdens for OLs and neurons as a function of age. SCAN2 estimates mutation burdens for each single cell individually by adjusting for sensitivity. Trend lines are mixed-effects linear regression models; outlier single cells with abnormally high or low mutation burdens, indicated by crosses, were excluded from the linear regressions (see STAR Methods).
(D) Distribution of OL and neuronal sSNVs and indels in annotated gene regions. Enrichment/depletion levels are calculated by comparison with a null distribution obtained by randomly shuffling mutations across the genome followed by correction for somatic mutation detection sensitivity; error bars represent bootstrapped 95% CIs (see STAR Methods). Percentages give the observed mutation count divided by the expected mutation count from the null distribution in each region.
(E) Percent of somatic mutations in the total mutation catalog with HIGH, MODERATE, and LOW impact on genes, as determined by SnpEff. See also Figures S1, S2, S3, and S4 and Tables S1, S2, and S3.

