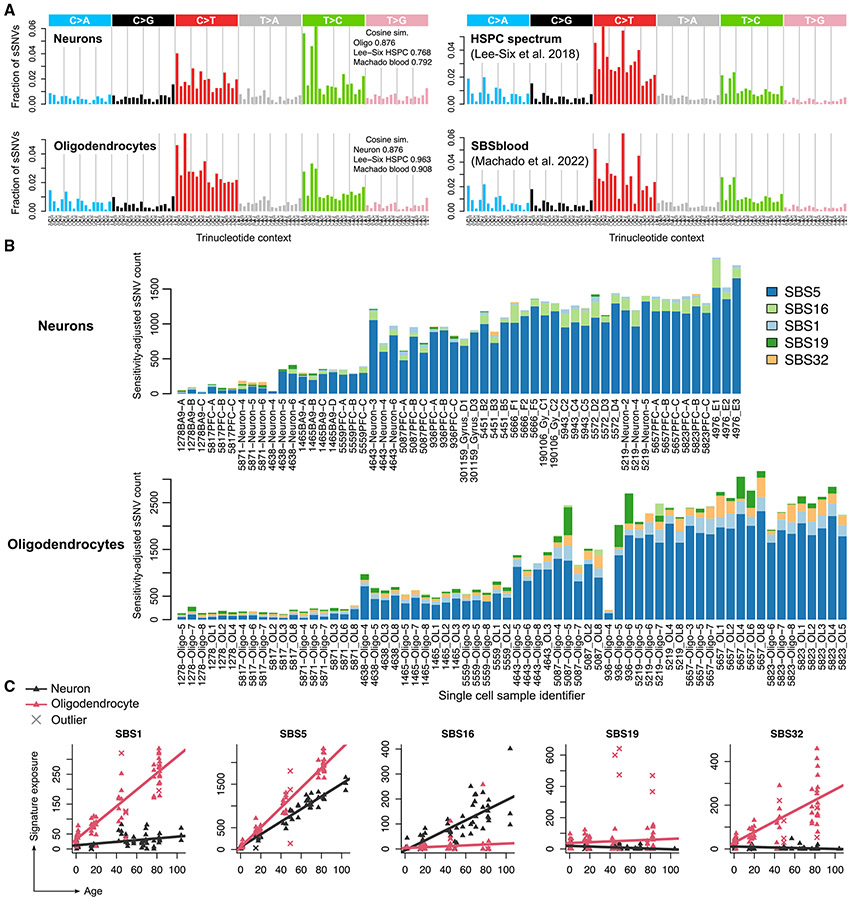
Figure 2. The composition of somatic SNVs, reflected in exposure to COSMIC mutational signatures, also differs between neurons and oligodendrocytes.
(A) SBS mutational spectra of neuronal and oligodendrocyte sSNVs identified in this study (left column); the spectrum of hematopoietic stem and progenitor cells (HSPCs) identified in Lee-Six et al.,45 and a signature derived from an analysis of human lymphocytes (Machado et al.46). Cosine similarities are shown for each pair of spectra.
(B) The number of somatic mutations, after extrapolation to genome-wide burdens, attributed to each COSMIC SBS signature by SigProfilerExtractor for each PTA single OL and neuron. Subjects are ordered from young (left) to elderly (right).
(C) Same signature exposure values in (B) plotted against age. Each point represents one single cell. Crosses indicate the outlier cells, in terms of total mutation burden, as identified in Figure 1C. Trend lines are linear regression models from which outliers were excluded (see STAR Methods).
See also Figure S4.

