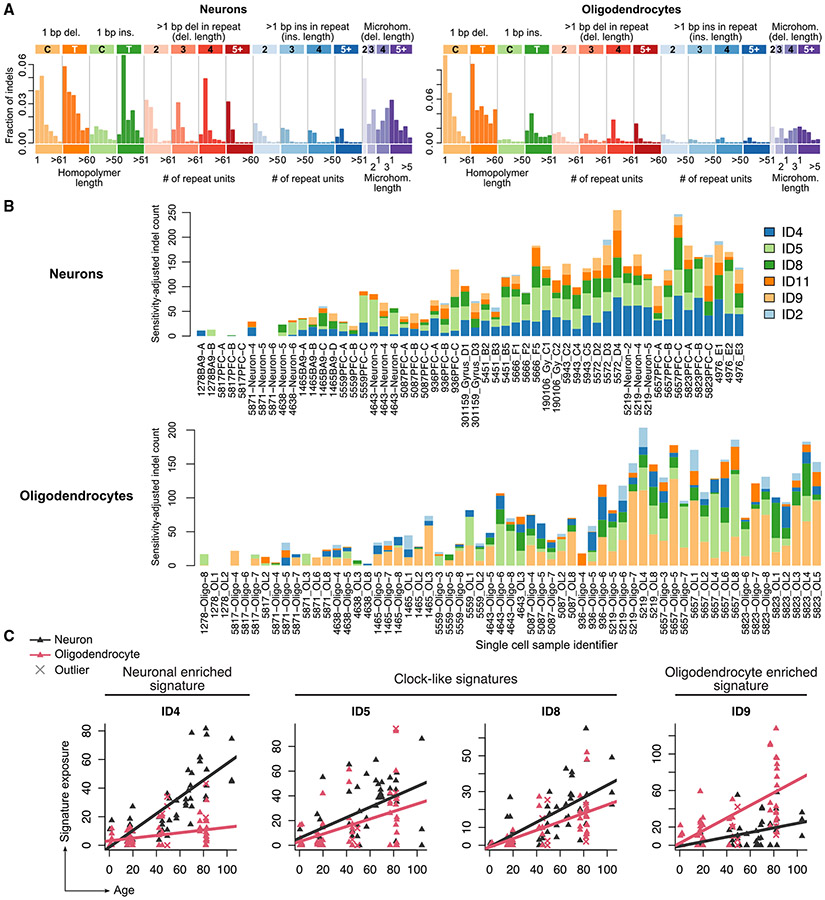
Figure 4. Insertion and deletion COSMIC signatures in human oligodendrocytes and neurons suggest differing mutagenic mechanisms.
(A) Spectra of somatic indels from human OLs and neurons using the 83-dimensional indel classification scheme from COSMIC.
(B) Contribution of COSMIC indel signatures to each single OL and neuron. One bar represents one single cell; cells are ordered according to age, with the youngest individuals on the left and eldest individuals on the right.
(C) Same as (B), but signature exposure is plotted against age for each single cell; each point represents one cell and crosses represent total mutational burden outliers. Trend lines are linear regression models from which outliers are excluded (see STAR Methods). ID5 and ID8 are annotated as clock-like signatures in COSMIC.

