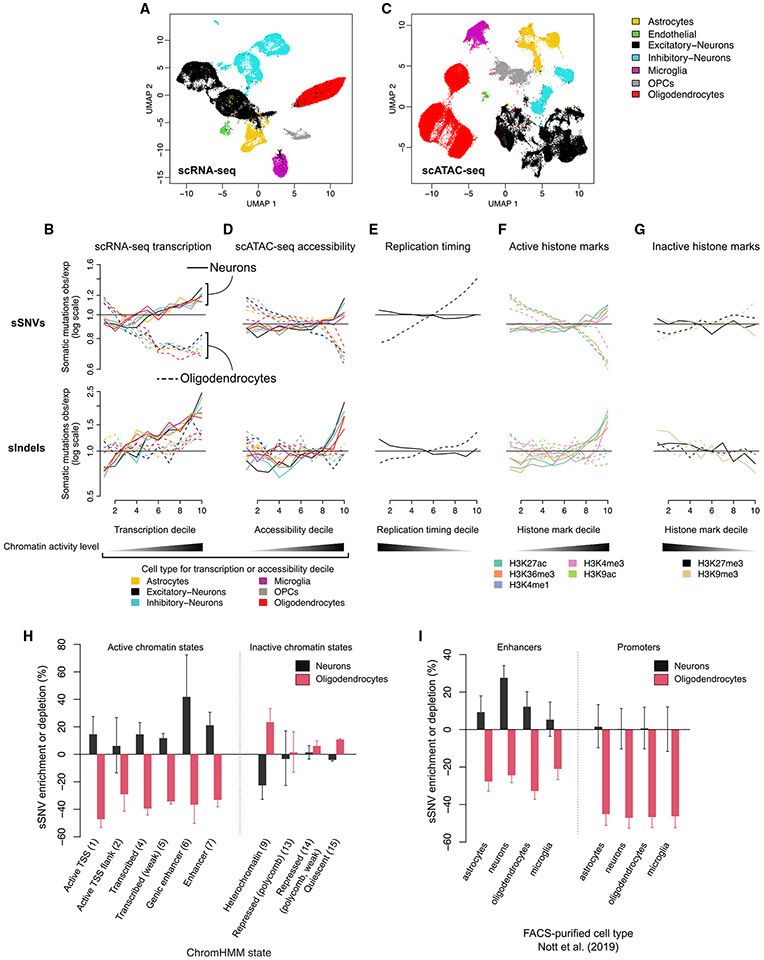
Figure 5. Oligodendrocyte somatic mutations are associated with inactive chromatin, while neuronal mutations associate with active chromatin.
(A) Uniform manifold approximation and projection (UMAP) plot of integrated snRNA-seq from three subjects (UMB1465, UMB4638, and UMB4643) with cell type annotations.
(B) Enrichment analysis of somatic mutations vs. snRNA-seq transcription level. The genome is divided into 1 kb, non-overlapping windows, and each window is annotated with an average gene expression level per cell type; windows that are <20% covered by a gene are discarded. The remaining windows are classified into 10 deciles, with 1 representing the least transcribed and 10 representing the most transcribed. In each decile, the observed number of somatic SNVs and indels is compared with a null distribution of mutations obtained by randomly shuffling mutation positions followed by correction for somatic mutation detection sensitivity (see STAR Methods). Each line shows somatic mutation density vs. transcription level from one cell type identified in our snRNA-seq; solid lines indicate mutation density measured in PTA neurons and dashed lines indicate PTA oligodendrocytes.
(C and D) Same as (A) and (B) for snATAC-seq from the brains of 10 subjects from this cohort.
(E) Enrichment analysis of replication timing, as measured by ENCODE RepliSeq; lines represent average enrichment across 15 cell lines.
(F and G) Enrichment analysis of 5 epigenetic marks related to gene activity (F) and two repressive epigenetic marks (G) measured in dorsolateral prefrontal cortex tissue (Roadmap Epigenomic Project, reference epigenome E073).
(H and I) Enrichment analysis of functional genomic regions identified by ChromHMM in reference epigenome E073 (H) or active enhancers and promoters identified in Nott et al.54 for several brain cell types (I).
Numbers in parentheses indicate the ChromHMM state number (H). Error bars represent bootstrapped 95% CIs (see STAR Methods).
See also Figure S5.

