
Fig. 1 |. Adaptation to river and cave habitats with marked differences in parasite diversity results in changes of cellular immune response.
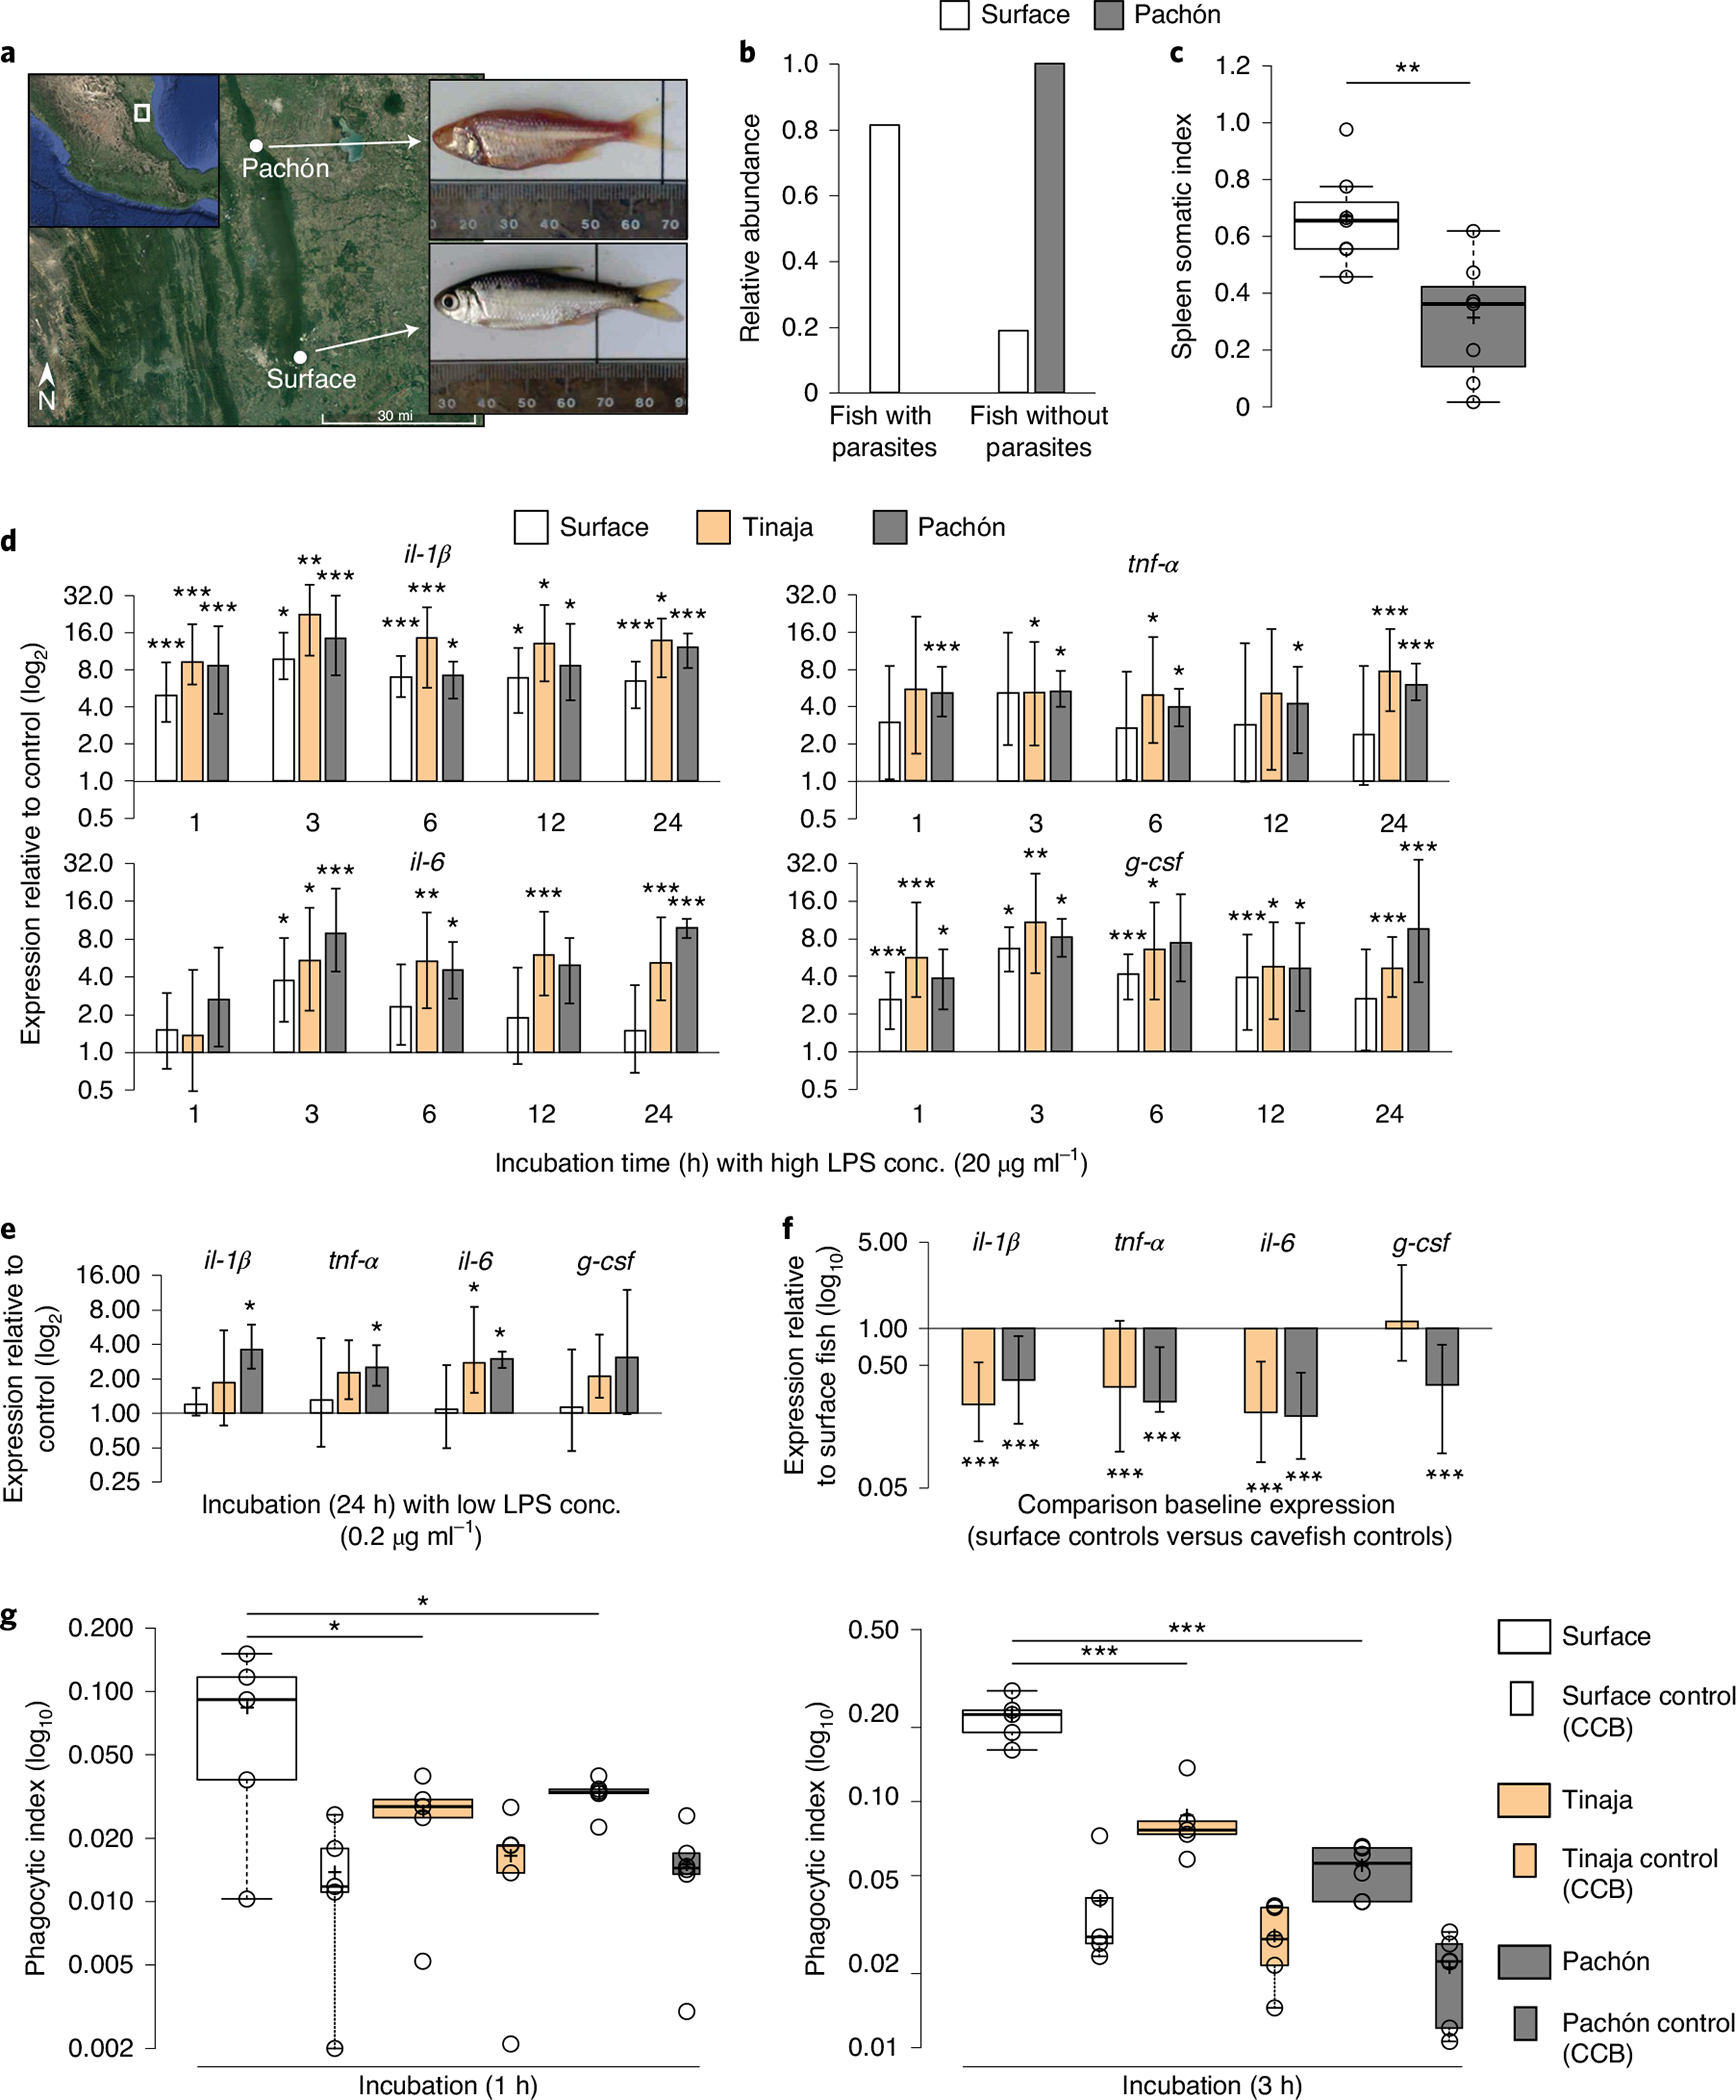
a, Collection sites of A. mexicanus surface fish (Río Choy) and cavefish (Pachón). Credit: Google Earth 2019 Landsat/Copernicus (map source); Google 2019, INEGI (map data). b, Number of fish with and without visible ecto- and endoparasites. c, Immune activity in wild surface and cavefish (each n = 7) using spleen somatic index: (weight (mg) (spleen)/weight (mg) (fish)) × 1,000. Significances were determined by one-way ANOVA. d,e, RT–qPCR analysis of pro-inflammatory cytokines, il-1β, tnf-α, il-6 and g-csf of HK cells from surface fish and cavefish after incubation with 20 μg ml−1 LPS at various time points (d) or 0.2 μg ml−1 LPS after 24 h (e) relative to HK cells incubated with PBS for the given time point. Plotted is the mean of three independent experiments with s.e.m. PBS control samples from each time point and sample were used as the reference to calculate relative expression of target genes for each time point and fish, respectively. f, RT–qPCR-based expression analysis of pro-inflammatory cytokines il-1β, tnf-α, il-6 and g-csf of cavefish relative to surface fish of naïve HK samples across all time points as shown in d (n = 18, error bar indicates s.e.m.). Significance values were determined by pairwise fixed reallocation randomization test using REST2009 software71. g, Box plot presentation of relative phagocytic rate of HK cells from surface fish and cavefish incubated with Alexa-488-coupled S. aureus. Control samples (HK cells incubated with Alexa-488-coupled S. aureus + 80 μg CCB) are presented in boxes. Significant differences between surface fish (n = 5), Tinaja (n = 5) and Pachón (n = 6) for each time point were determined by two-way ANOVA (see Supplementary Data 2 for statistical details). For all box plots, centre lines show the medians, crosses show means, box limits indicate the 25th and 75th percentiles as determined by R software80, whiskers extend 1.5× the interquartile range from the 25th and 75th percentiles and data points are represented by circles.