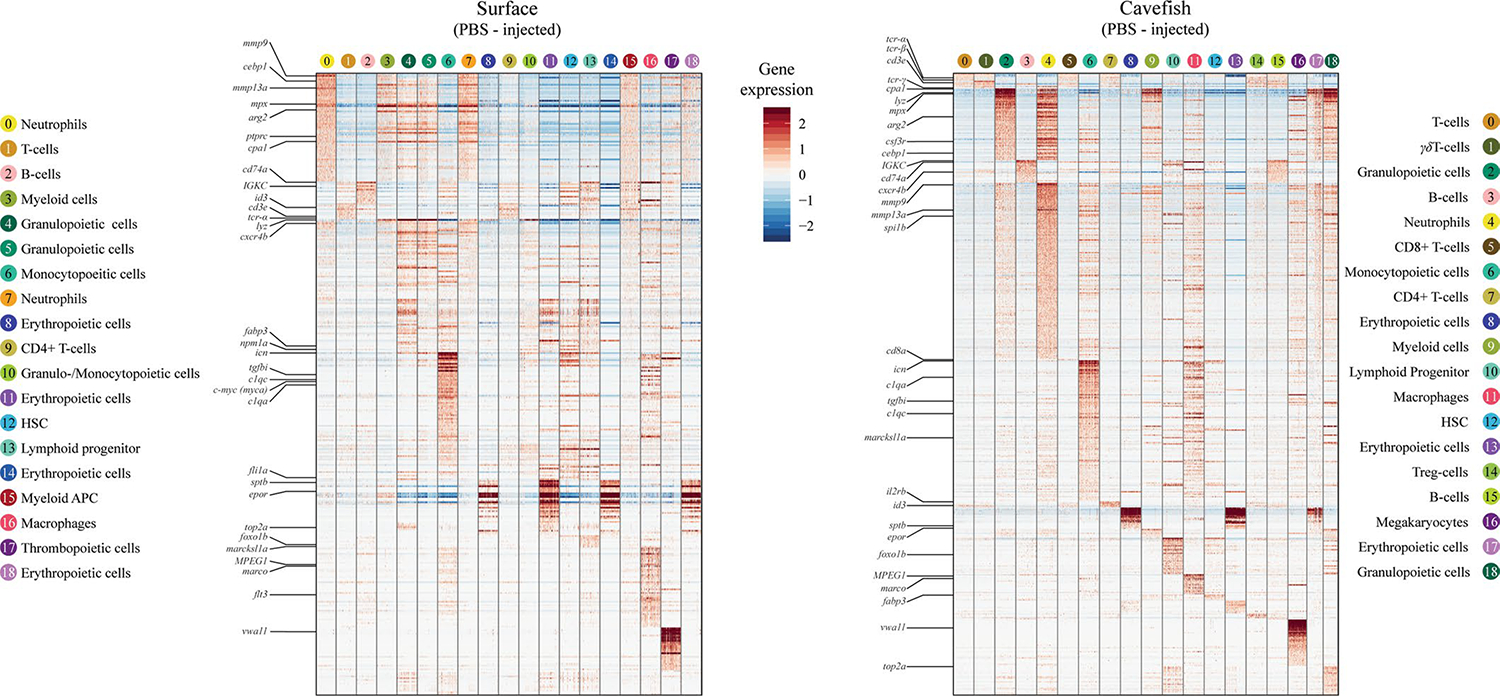
Extended Data Fig. 3 |. HK cell gene expression profiles of PBS injected fish.

Heatmap of enriched genes within each cell cluster of control groups from surface fish and cavefish. Genes that were used for cell cluster identification are shown. For a complete heatmaps for PBS and LPS injected groups see Supplementary Data 6–9.
