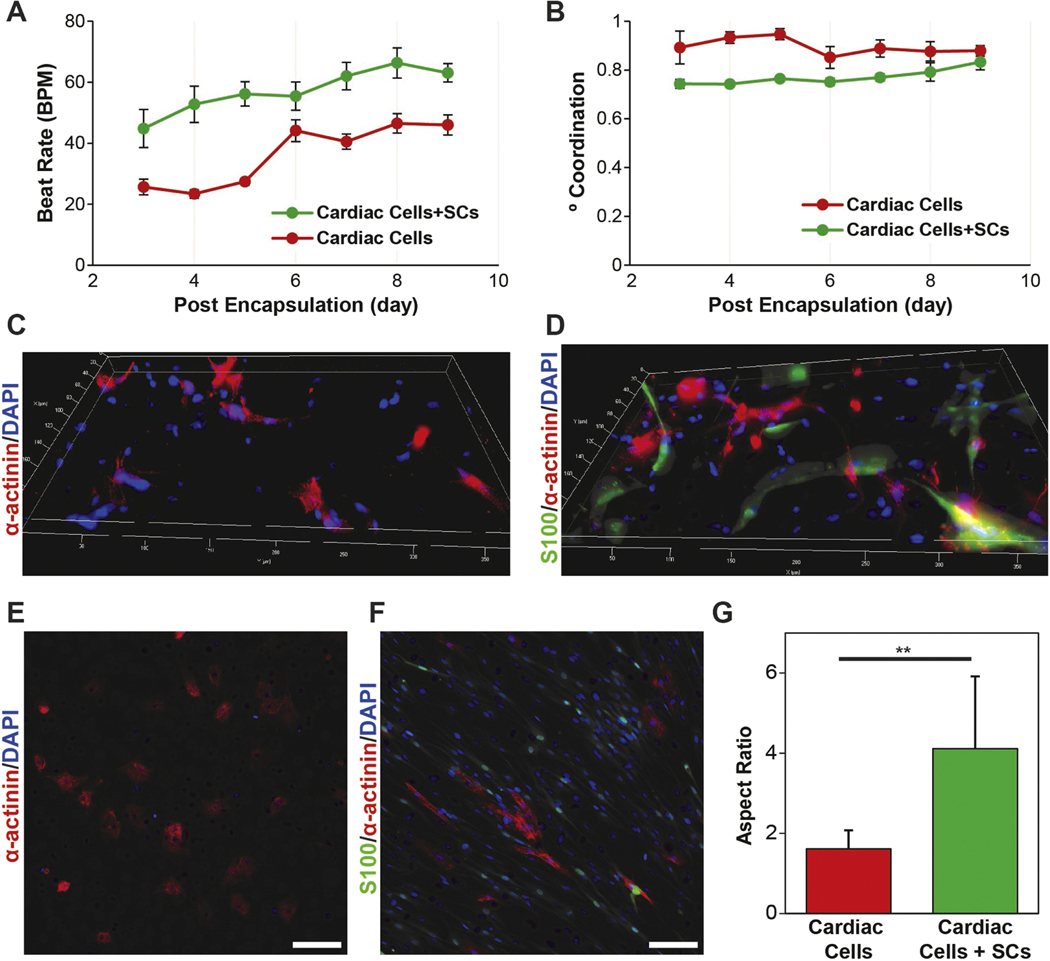
Figure 5.
Role of SCs in the 2D and 3D cardiac cell cultures. (A) Quantification ofBPMand (B) DoC for 3D μTissues over time showing that the inclusions of SCs leads to an increase and beat rate and decrease in coordinated contractions. (C) Representative immunofluorescent images of cardiac cells culture without and (D) with the inclusion of exogenous SCs encapsulated in 3D μTissues. (E) Representative immunofluorescent images of cardiac cells culture without and (F) with the inclusion of exogenous SCs in 2D (scale = 100 μm) and (G)CM aspect ratio quantification (**p < 0.05).

