Figure 2.
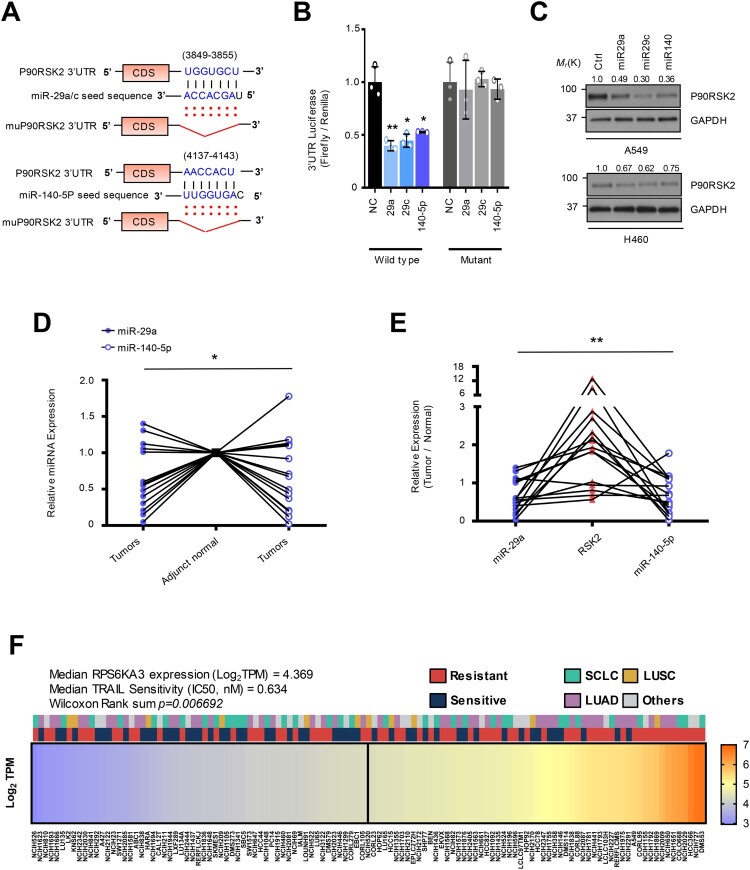
MiR-29a/c and -140-5p directly suppressed RSK2 protein expression causing TRAIL-sensitivity (A) A schematic diagram showing seed sequence of miR-29/-140-5p and the target sequence of RPS6KA3 3’UTR. (B) Luciferase reporter assay using 3’UTR of RPS6KA3 or 3’UTR harboring deletion mutations of the miR-29a/c and -140-5p in HEK293 cells over-expressing miR-29a/c or-140-5p. Error bars indicate mean ±SD (n = 3). P-values were calculated by two-tailed student t-test. (C) Western blot analysis indicating suppressed RSK2 protein level in lung cancer cells. Indicated cells were transfected by indicated miRNAs, respectively. After 48h, cells were harvested and subjected to Western blotting with indicated antibodies. (D) Expressional comparison of the miR-29a and -140-5p in lung cancer tissues compared to their adjunct normal tissues. Taqman-based qRT-PCR analysis was applied to analyze expression of the target miRNAs, and the expression of the target miRNAs in each cancer sample (n = 15) was normalized by their paired control sample (n = 15), respectively. P-values were obtained by one-way ANOVA test (* p < 0.05). (E) Correlation analysis of miR-29a/-140-5p and RSK2 protein expression in cancer. Expression of RSK2 protein was quantitated by measuring band intensities using Image J software. The intensity in cancer sample was normalized by paired normal sample. Likewise, relative value for miR-29a or miR-140-5p was calculated by comparing qRT-PCR values between cancer sample (n = 15) and its paired control sample (n = 15). P-value was obtained by one-way ANOVA test (**p < 0.01). (F) Expressional correlation of RPS6KA3 and TRAIL-sensitivity in NSCLC. TRAIL-sensitivity for each cell line was obtained from previous literatures and colored by their sensitivity as indicated. For statistical analysis, cell lines were divided into two groups with median RPS6KA3 expression, annotated by TRAIL-sensitivity from literatures, Wilcoxon rank sum test was applied to obtain significance. Detailed information about mRNA expression of RPS6KA3 gene and TRAIL-sensitivity is described in Material and Methods section. Gene Ontology analysis using upregulated and downregulated genes in H460R cells showing differentially regulated pathways. (*p < 0.05, **p < 0.01)

