Figure 1.

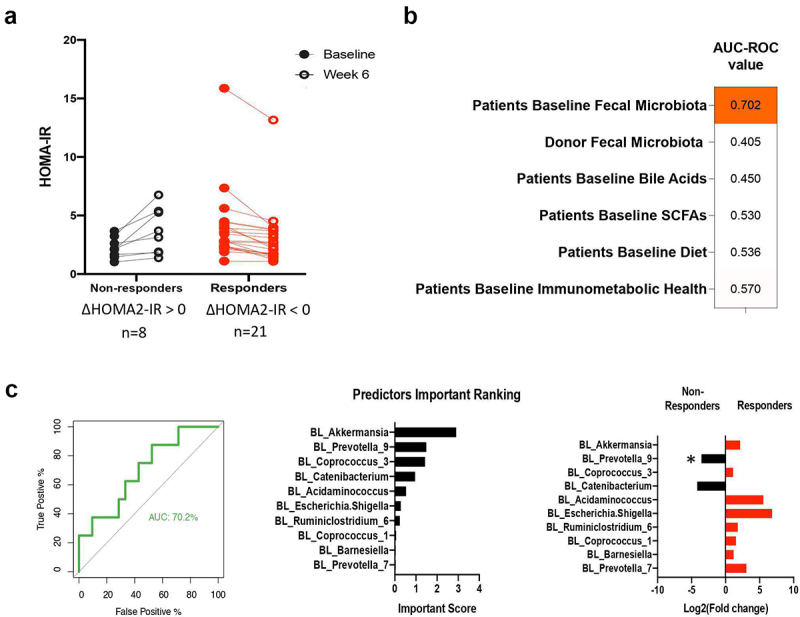
Identification of FMT recipient factors that predict HOMA-IR responses by machine learning.
Line graphs show differences in the effects of (a) FMT with fiber supplementation on HOMA-IR for responders and non-responders, as defined according to changes in HOMA-IR from baseline to week 6 (decreased vs. increased). AUC-ROC values show the performance accuracy of random forest classifiers for predicting responders from non-responders in (b) FMT with fiber supplementation induced HOMA-IR attenuation. Prediction performance of random forest classifiers trained to predict FMT plus fiber responders in HOMA-IR. (c) (left) AUC-ROC curves show the performance accuracy of random forest classifiers trained to predict responders vs. non-responders for HOMA-IR with FMT plus fiber treatment using the relative abundance of the patient’s baseline fecal microbiota at genus level; (center) Horizontal bars represent the top 10 important taxa for predicting responses; (right) Horizontal bars represent taxa comparisons between responders and non-responders. * Indicates p value < .05 using Wilcoxon test. Δ, absolute change from baseline to week 6; AUC-ROC, area under the receiver operating characteristic curve; HOMA-IR, homeostatic model assessment of insulin resistance; FMT, Fecal microbiota transplant.
