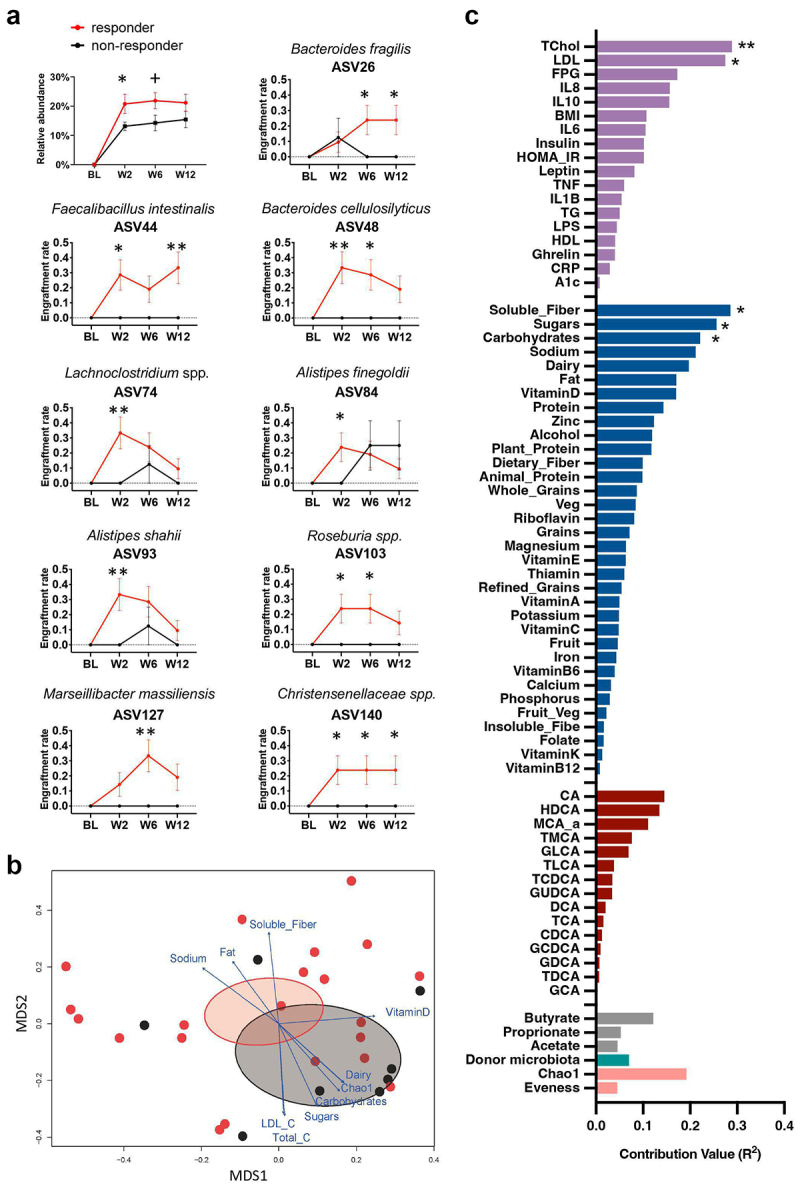
Figure 3.

FMT recipient baseline factors predict donor-specific ASVs engraftment.
(a) Comparison of the donor-specific ASVs fraction retained in the FMT-recipients between responders and non-responders over the 12 weeks. Line charts compare the ratio of FMT recipients who retained donor-specific ASVs in total number of the recipients (engraftment rate) among responders vs. non-responders. ASVs that had a significantly higher engraftment rate in the responders relative to the non-responders were selected (p < .05). Statistical analysis was performed by repeated measures ANOVA models for assessing the main factor effect. Comparisons were made between the two groups at each time point by t-test with Welch correction. Data are reported as mean ± SEM [+p < .1, *p < .05, **p < .01]. ASV26: Bacteroides fragilis; ASV44: Faecalibacillus intestinalis; ASV48: Bacteroides cellulosilyticus; ASV74: Lachnoclostridium spp.; ASV84: Alistipes finegoldii; ASV93: Alistipes shahii; ASV103: Roseburia spp.; ASV127: Marseillibacter massiliensis; ASV140: Christensenellaceae spp. ASV, amplicon sequence variant. (b) Weighted metric multidimensional scaling based on Bray-Curtis dissimilarity and environmental fitting test analysis (envfit) displaying top 10 recipient baseline factors explaining donor-specific ASVs distribution variation between responders and non-responders at week 6. (c) The figure C evaluated contribution degrees of baseline factors affecting the donor-specific ASVs community in the FMT recipients (measured using coefficient of determination (R2)). And the significant association was tested using permutation test (n = 999) in the vegan package [*p < .05, **p < .01].
