
Figure 1.
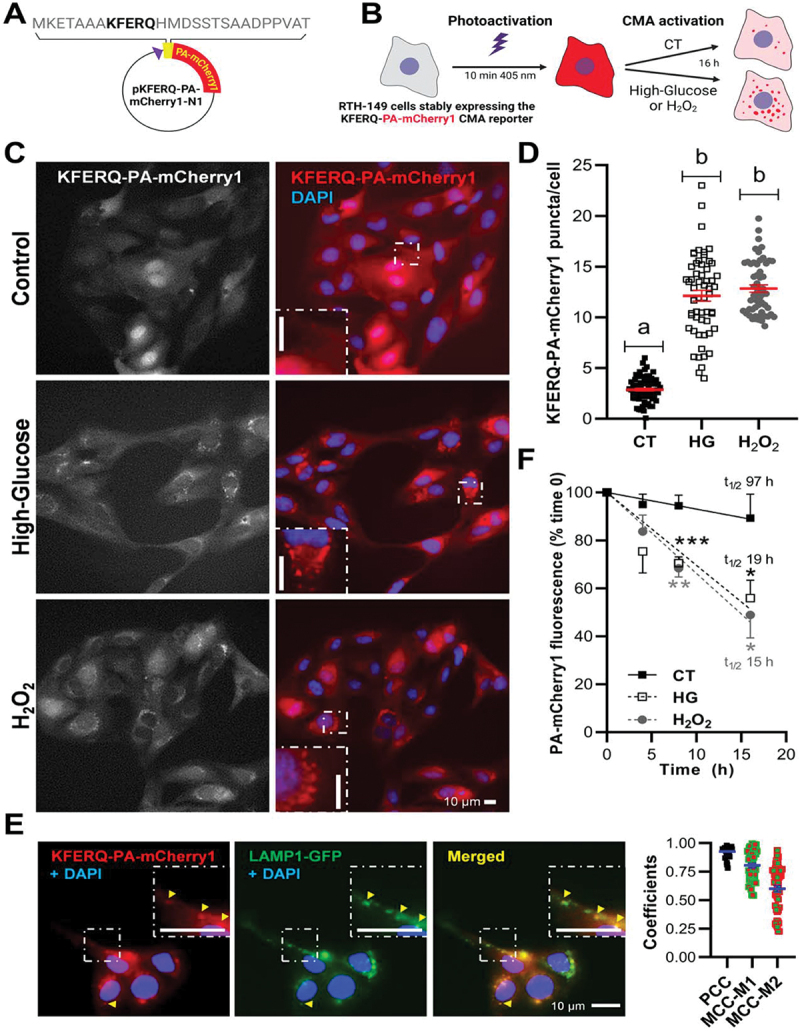
Both elevated glucose (25 mM) and mild-oxidative stress (H2O2 25 µM) induced relocalization of the fluorescence diffuse pattern of the KFERQ-PA-mCherry1 reporter to form puncta colocalizing with lysosomes, and reduced the half-life of the reporter. (A) Schematic representation of the pKFERQ-PA-mCherry1-N1 construction and amino acid sequence including the KFERQ-CMA targeting motif. (B) Simplified scheme of the experimental design. (C) Representative images of RTH-149 cells stably expressing a KFERQ-PA-mCherry1 reporter visualized by fluorescence microscopy after 16 h exposure to control (glucose 5 mM), high-glucose (glucose 25 mM) or mild-oxidative stress (H2O2 25 µM and glucose 5 mM). Images were originally acquired in grey, and nuclei were stained with DAPI (blue). Both experimental conditions induced the translocation of the CMA reporter to form fluorescent puncta, as can be observed in the insets in comparison with the control group, where the reported showed a diffuse pattern. (D) Quantification of KFERQ-PA-mCherry1 reporter number of puncta per cell. All values correspond to individual images (CT 70; HG 57; H2O2 55), with > 15 images/experiment in a total of 3 independent experiments (>900 cells for condition). Different letters denote significant differences between groups compared by one-way ANOVA (p < 0.0001) followed by Bonferroni’s multiple comparisons tests. (E) Representative images of HG-induced KFERQ-PA-mCherry1 puncta (red) in cells transiently transfected with LAMP1-GFP (green) visualized by fluorescence microscopy. Most of the KFERQ-PA-mCherry1 puncta colocalized with the green lysosomal marker LAMP1-GFP, as indicated by the arrowheads and amplified in the insets, and as supported in the plot by the PCC and MCCs results of the global analysis of 50 single cells using the BIOP version of JACoP pluging for Fiji. (F) The lysosomal internalization of the CMA reporter and its decay in fluorescence was quantified to infer CMA flux as the difference between the total fluorescence after photoactivation (0 h, 100%) and the remaining signal after 4, 8, or 16 h incubations in a minimum of 4 independent experiments. The higher reduction in the red fluorescence intensity upon HG or H2O2 exposure compared with cells incubated in the CT medium supports its enhanced degradation under these conditions, which is confirmed by the shortened half-lives (t1/2) of the reporter (19 h for HG and 15 h for H2O2; vs. 97 h for CT). Unpaired Student’s T-test was used to compare each condition to the CT (*p < 0.05; **p < 0.01; ***p < 0.001). All data are presented as Mean ± SEM; scale bars: 10 µm.