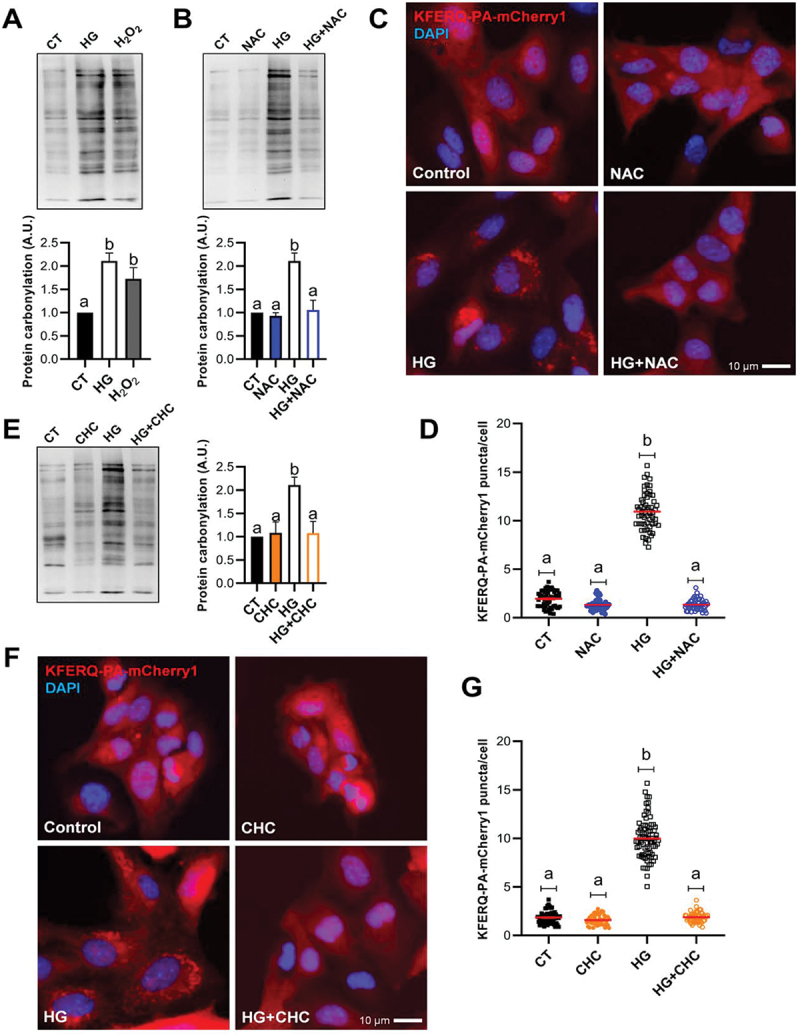
Figure 2.

Oxidative stress induced by the use of high-glucose at the mitochondria was associated with the formation of CMA-puncta. (A) Protein carbonylation levels in RTH-149 cells after 8 h exposure to control (CT; glucose 5 mM), high-glucose (HG; glucose 25 mM), or mild-oxidative stress (H2O2; hydrogen peroxide 25 µM and glucose 5 mM) analyzed using OxyBlot western blot. Different letters denote significant differences between groups compared by one-way ANOVA (p < 0.004) followed by Tukey’s multiple comparisons tests in 4 independent experiments. (B) The presence of the antioxidant NAC (10 mM) prevented the generation of carbonylated proteins by HG. One-way ANOVA (p < 0.0005) followed by Bonferroni’s multiple comparisons tests was used to compare between groups in 3–4 independent experiments. (C and D) The presence of NAC prevented the formation of KFERQ-PA-mCherry1 puncta after 16 h exposure to high-glucose. The values in (D) correspond to individual images (CT 56; NAC 45; HG 57; HG+NAC 48), with ≥ 15 images/experiment in a total of 3 independent experiments (>1,000 cells for condition). (E) The inhibition of the pyruvate mitochondrial transporter using CHC (100 µM) reduced the HG-induction of carbonylated proteins. One-way ANOVA (p < 0.003) followed by Bonferroni’s multiple comparisons tests was used to compare between groups in 3–4 independent experiments. (F and G) the presence of CHC prevented the formation of KFERQ-PA-mCherry1 puncta after 16 h exposure to high-glucose. All values in (G) correspond to individual images (CT 62; NAC 48; HG 76; HG+NAC 55), with ≥ 15 images/experiment in a total of 3 independent experiments (>1,000 cells for condition). In D and G, different letters denote significant differences between groups compared by the non-parametric kruskal-wallis test (p < 0.0001) followed by Dunn’s multiple comparisons tests. All data are presented as Mean ± SEM; scale bars: 10 µm.
