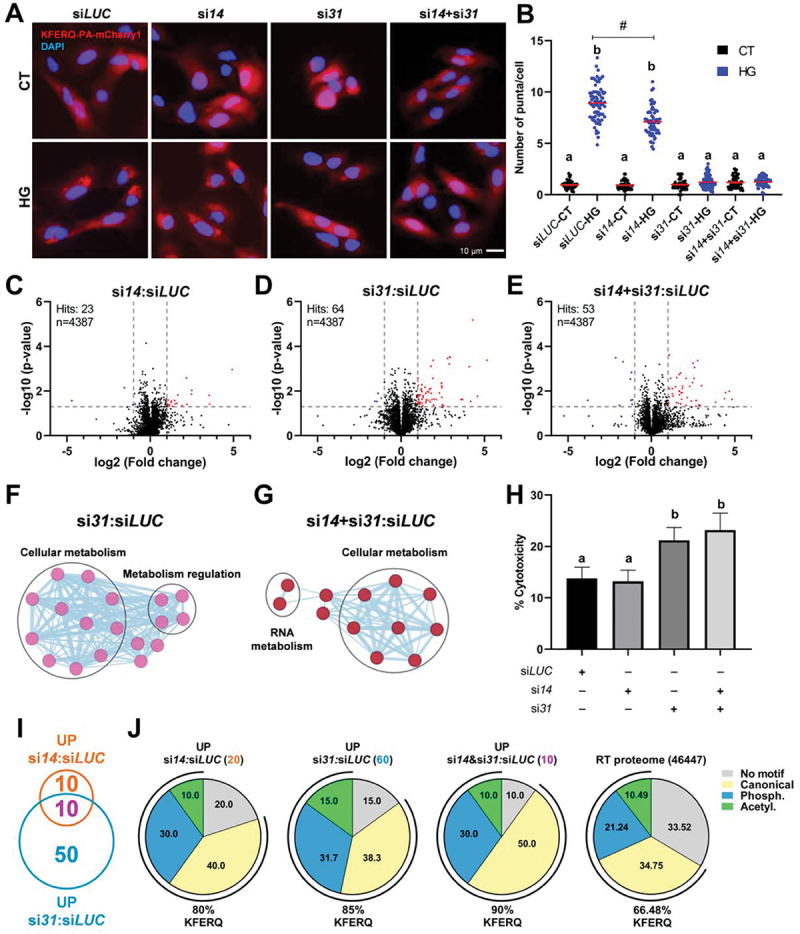
Figure 4.

CMA plays a protective role to maintain cellular homeostasis during hyperglycemic stress, mainly mediated by the Lamp2A paralog encoded by Chr 31. (A) Effects of siRNA-mediated knock-down of either (si14 and si31) or both (si14+si31) RT Lamp2A’s on CMA activity. The reduction of the lamp2a isoform from Chr 14 mRnas did not prevent the increase of KFERQ-PA-mCherry1 puncta formation upon 16 h HG exposure (A; quantification in B). In contrast, decreased expression of either the Chr 31 or both lamp2a isoforms strongly abolished the HG-induced CMA puncta formation. All values correspond to individual images (siLUC-CT 55; siLUC-HG 76; si14-CT 62; si14-HG 59; si31-CT 67; si31-HG 75; si14+si31-CT 60; si14+si31-HG 61), with > 18 images/experiment in a total of 3 independent experiments (>600 cells for condition). Different letters denote significant differences between groups compared by the non-parametric kruskal-wallis test (p < 0.0001) followed by Dunn’s multiple comparisons tests; # denotes differences between siLUC-HG and si14-CT groups compared by the Mann Whitney test (p < 0.0001). All data are presented as Mean ± SEM. (C) volcano plot of the quantitative proteomic analysis of RTH-149 cells transfected with si14, (D) si31, or (E) si14+si31, incubated in HG media for 48 h and compared to siLUC. In the top left is presented the number of significant hits and the number of proteins identified. Blue dots indicate differentially downregulated proteins, and red dots correspond to upregulated proteins (p < 0.05 with ≥ 2 fold change (FC)). Four replicated samples for each condition were analyzed. Network representation of the gene ontology biological process enrichment analysis of proteins modified in si31 (F) or si14+si31 (G) transfections compared with siLUC, generated in CytoScape (3.9.1) using EnrichmentMAP (3.3.5), and annotated with AutoAnnotate (1.4.0) apps. Thresholds were set as 0.2 (connectivity cutoff); 0.25 (edge cutoff); p < 0.05; FDR < 0.05. (H) Cell cytotoxicity measured as the activity of lactate dehydrogenase (LDH) released from cells transfected with siLUC, si14, si31, or si14+si31 and incubated, 24 h post-transfection, with HG medium during 48 h. Different letters denote significant differences between groups compared by one-way ANOVA (p < 0.003) followed by Tukey’s multiple comparisons tests in triplicates of three independent experiments. Data are presented as Mean ± SEM. (I) Venn diagram of significantly upregulated proteins in si14 or si31 compared with siLUC, showing the number of overlapping and non-overlapping proteins between these conditions, and (J) percentage of proteins from those three groups and of the total RT proteome containing KFERQ-like motifs (bottom values), as well as of the proteins ranked to each motif type (i.e., canonical, phosphorylation- or acetylation-dependent motifs) according to [55].
