Figure 5.

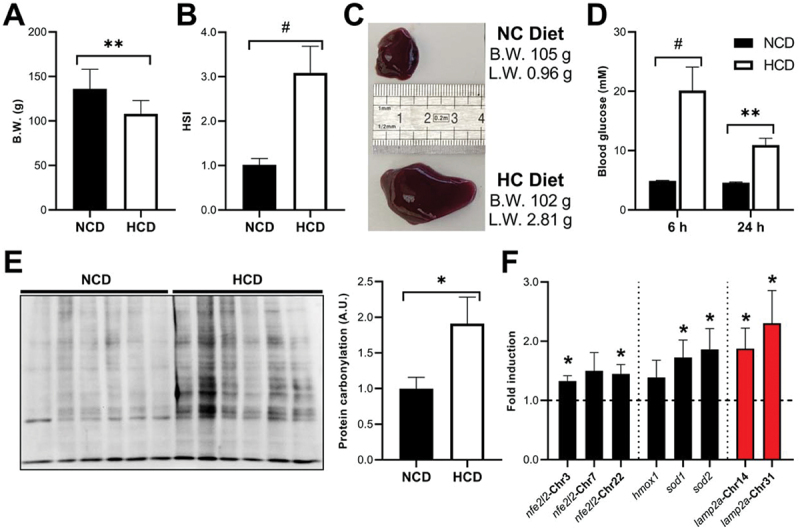
Rts fed a high-carbohydrate diet (HCD) for 9 weeks exhibited signs of glucose intolerance characterized by decreased growth, increased liver weight, and elevated post-prandial blood glucose levels. They also presented signs of oxidative stress and upregulated lamp2a mRnas, compared to fish fed a diet free of carbohydrates (NCD). (A) Final body weight (B.W.) at 9 weeks of the experiment. Unpaired Student’s T-test was used to compare between groups (*p < 0.05; **p < 0.01). (B) The hepatosomatic (HSI) index was calculated as HSI = (liver weight/animal weight) × 100 at 9 weeks of the experiment. Unpaired Student’s T-test was used to compare between groups (#p < 0.0001). (C) Representative images of livers from similar-B.W. fish fed with the NCD (top) or the HCD (bottom) during 9 weeks. (D) Blood glucose levels at both 6 and 24 h post-prandial in NCD and HCD-fed fish after 9 weeks of the experiment. Differences between groups at each time point were assessed using the Mann Whitney test (**p < 0.01; #p < 0.0001). (E) Protein carbonylation levels in the liver of fish fed with the NCD or the HCD for 9 weeks were analyzed using OxyBlot. Unpaired Student’s T-test was used to compare between groups (*p < 0.05). Mean ± SEM. (F) Hepatic mRNA levels of the three RT nfe2l2 paralogs, Nfe2l2-target genes, and the two RT lamp2a paralogs in fish fed with the NCD or the HCD for 9 weeks. Unpaired Student’s T-test was used to compare between groups (*p < 0.05). All data are presented as Mean ± SEM of 9 fish/group.
