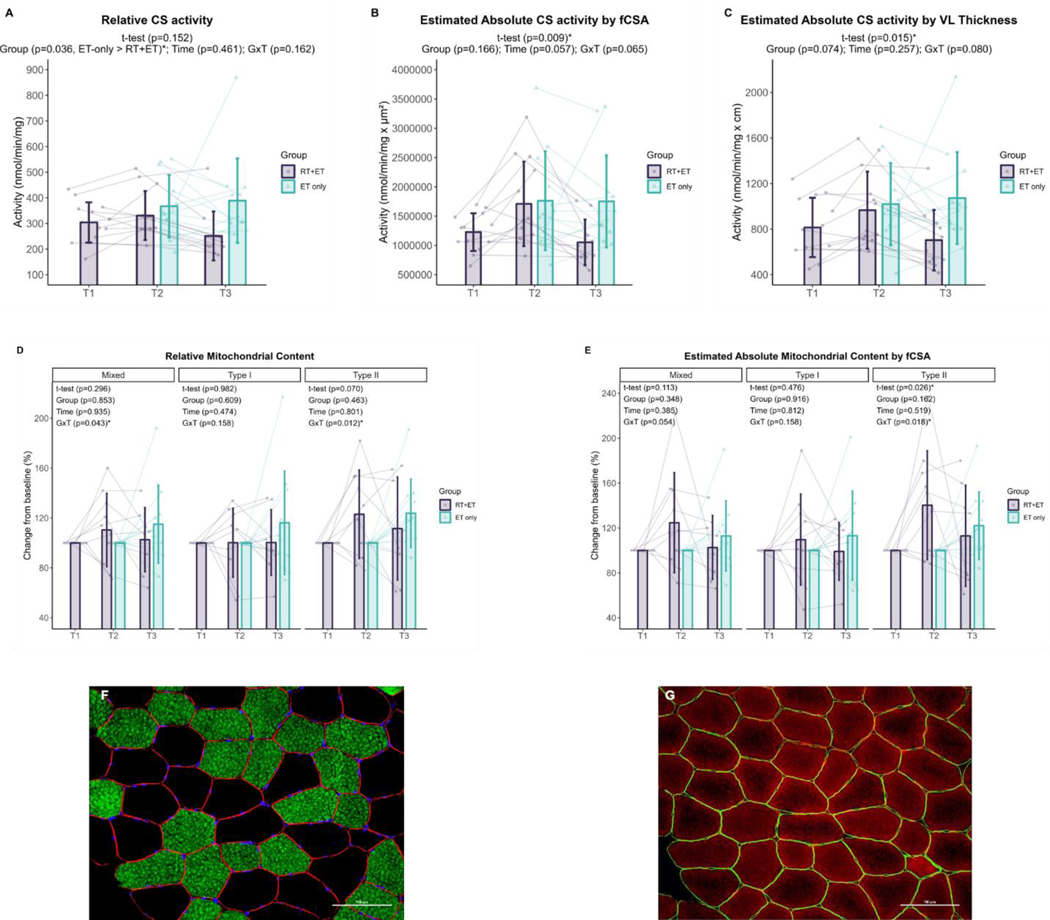
Figure 7. Mitochondrial content responses to RT and ET.
A, Relative maximal CS activity (T1-T2: n=13; T2-T3: RT+ET, n=11; ET-only, n=12). B, Total mitochondrial content estimation (via maximal CS activity and mixed fCSA values) (T1-T2: n=13; T2-T3: RT+ET, n=11; ET-only, n=12). C, Total mitochondrial content estimation (via maximal CS activity and VL thickness) (T1-T2: n=13; T2-T3: RT+ET, n=11; ET-only, n=12). D, Relative mitochondrial content (via TOMM20 IHC) (T1-T2: n=9; T2-T3: RT+ET, n=9; ET-only, n=8). E, Total mitochondrial content estimation (via TOMM20 IHC and mixed fCSA values) (T1-T2: n=9; T2-T3: RT+ET, n=9; ET-only, n=8). F-G, Representative images of serial cross-sectional staining. F, Dystrophin (red), MHCI (green), DAPI (blue). G, Dystrophin (green), TOMM20 (red). T1 = Pre-RT; T2 = Pre-ET; T3 = Post-ET. Data are expressed as mean ± SD, and individual respondent values are also depicted. Abbreviations: RT+ET, group that performed 7 weeks of resistance training followed by 7 weeks of endurance training; ET-only, group that performed 7 weeks of endurance training only; GxT, group x time interaction. Notes: t-test p-values are for the RT period in the RT+ET group, and the two-way ANOVA main effect and interaction p-values are for the ET period in both groups.

