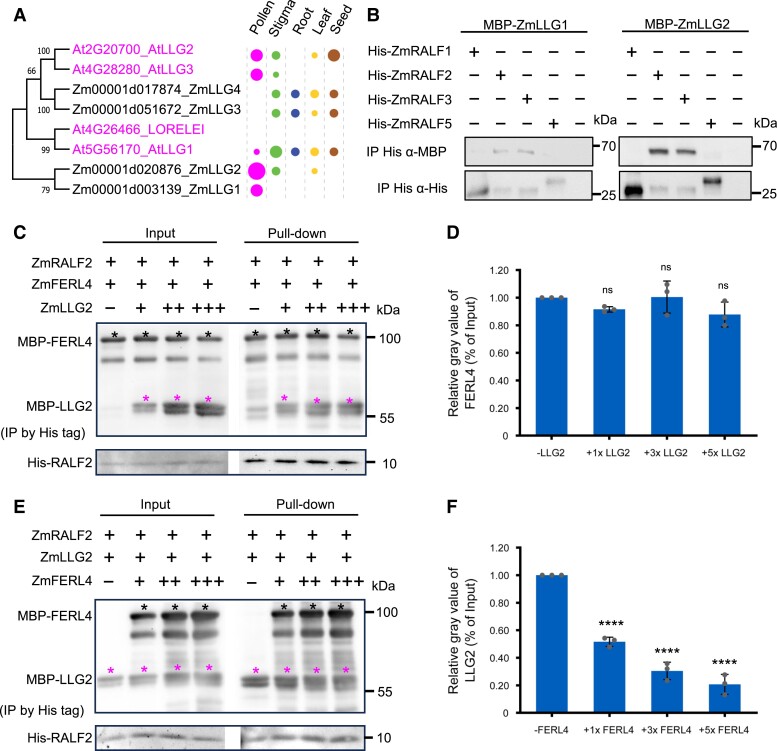
Figure 6.
Binding of Clade IB maize RALFs with LORELEI-like-GPI-anchored (LLG) co-receptors can be outcompeted by FERL receptors, but not vice versa. A) Phylogenetic tree of LLG proteins from maize and Arabidopsis. Expression pattern and relative transcript levels are indicated by dots (see Fig. 1A for explanations). The values at the nodes represent percent of bootstrap confidence level. B) Pull-down assay using MBP-tagged LLGs and His-tagged RALFs as indicated. Input images can be found in Supplementary Fig. S15. C) Competitive pull-down assays of RALF2 with FERL4 by LLG2. LLG2 at relative concentrations of 1×, 3×, and 5× were added to a solution containing RALF2 and FERL4. Black asterisks indicate protein bands of FERL4 and magenta asterisks indicate LLG2 protein bands. D) Quantification of relative gray values of FERL4 bands in pull-down assays relative to the input. Bar plot shows mean value and standard deviation. Experiments were repeated 3 times. Individual data points are indicated. ns, Not significant. Unpaired t-test, compared with the −LLG2 control. E) Competitive pull-down assays of RALF2 with LLG2 by FERL4. FERL4 at concentrations of 1×, 3×, and 5× was added to a solution containing RALF2 and LLG2. Black asterisks indicate protein bands of FERL4 and magenta asterisks indicate LLG2 protein bands. F) Quantification of relative gray values of LLG2 bands in pull-down relative to the input. Bar plot shows the mean value and standard deviation. Experiments were repeated 3 times. Individual data points are indicated. ****P < 0.0001. Unpaired t-test, compared with the −LLG2 control.

