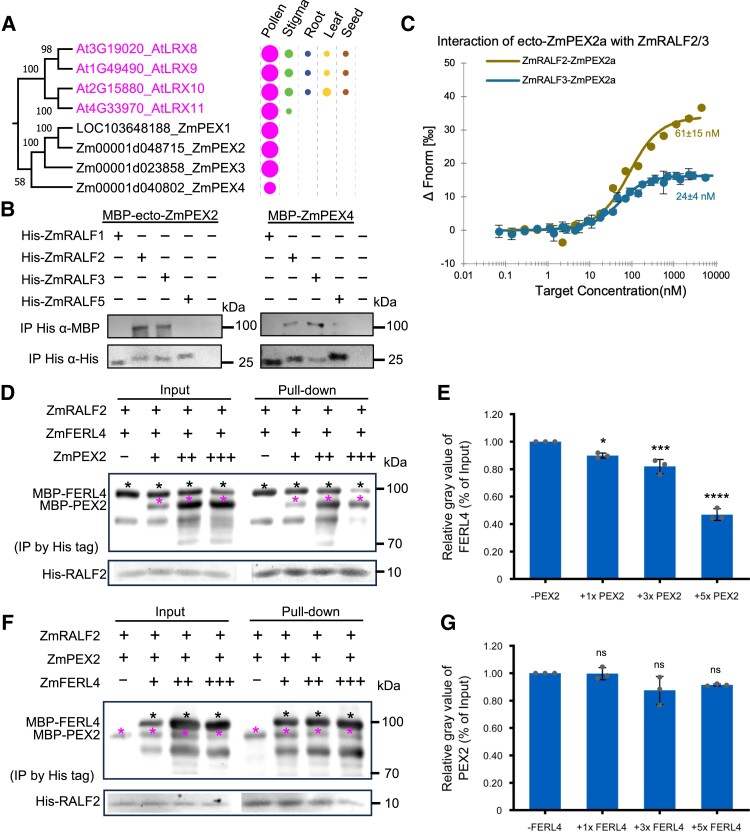
Figure 7.
Cell wall-localized maize PEX proteins physically interact via their LRR-domain with Clade IB RALFs and outcompete RALFs from FERL receptor complexes. A) Phylogenetic analysis of pollen-specific chimeric LRR-extension-like proteins in maize and Arabidopsis. The signal peptide sequence and conserved proline-rich extensin domain were removed before alignment. Expression pattern and relative transcript levels are shown as explained in Fig. 1A. The complete phylogenetic tree and detailed expression data including all LRR-extension-like proteins in maize and Arabidopsis as well as a protein alignment are shown in Supplementary Figs. S10 and S11. The values at the nodes represent percent of bootstrap confidence level. B) Pull-down experiment of MBP-tagged N-terminal LRR domain containing region of ZmPEX2 (ZmPEX2a) and full length ZmPEX4. C) MST binding affinity assay showing that ZmRALF2/3 have strong binding affinity with ZmPEX2a: ZmRALF2, Kd = 60 nm; ZmRALF3, Kd = 24 nm. D) Competitive pull-down assays of RALF2 with FERL4 by PEX2. PEX2 at concentrations of 1×, 3×, and 5× were added to a solution containing RALF2 and FERL4. Black asterisks indicate protein bands of FERL4 and magenta asterisks indicate PEX2 protein bands. The data are presented as the mean value ± Sds from 3 technical replicates, and similar results can be detected with 3 independent experiments. E) Quantification of relative gray values of FERL4 bands in pull-down relative to the input. Bar plot shows mean value and standard deviation. Experiments were repeated 3 times. Individual data points are indicated. *P < 0.05, ***P < 0.001, ****P < 0.0001. Unpaired t-test, compared with the −PEX2 control. F) Competitive pull-down assays of RALF2 with PEX2 by FERL4. FERL4 at concentrations of 1×, 3×, and 5× were added to a solution containing RALF2 and PEX2. Black asterisks indicate protein bands of FERL4 and magenta asterisks indicate PEX2 protein bands. G) Quantification of relative gray values of PEX2 bands in pull-downs relative to the input. Bar plot shows mean value and standard deviation. Experiments were repeated 3 times. Individual data points are indicated. ns, Not significant. Unpaired t-test, compared with the −FERL4 control.

