Figure 8.
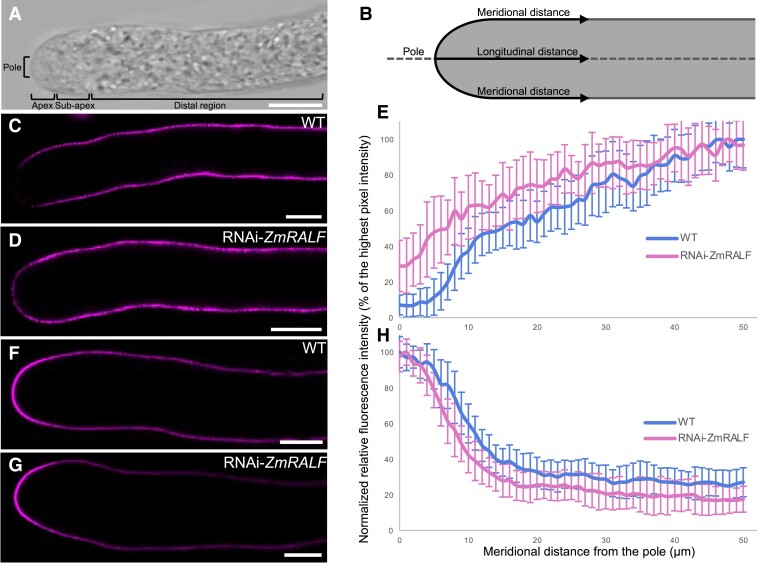
Pectin distribution in the pollen tube cell wall is altered in RNAi-ZmRALF mutants. A) Bright field image of a growing maize pollen tube showing various zones. The major growing zone is located at the pole and apex. The apex of the pollen tube is ∼3 to 4 μm, while the sub-apical region is ∼5 to 10 μm in length. Approximately 10 μm from the pole begins the distal region of the pollen tube. B) Schematic figure of a maize pollen tube. Fluorescent intensity in C), D), F), and G) was measured along meridional distances. C and D) Representative images of JIM5 labeled WT and RNAi-ZmRALF mutant pollen tubes, respectively. JIM5 monoclonal antibody labels de-esterified pectin/homogalacuronan. E) Fluorescent intensity quantification of JIM5 labeled WT and RNAi-ZmRALF mutant pollen tubes. n = 26 for both WT and RNAi-ZmRALF pollen tubes. The data are presented as the mean value ± Sds. F and G) Representative images of LM20 labeled WT and RNAi-ZmRALF mutant pollen tubes, respectively. LM20 monoclonal antibody labels esterified pectin/homogalacuronan. H) Fluorescent intensity quantification of LM20 labeled WT and RNAi-ZmRALF mutant pollen tubes. For WT pollen tubes, n = 19 and for RNAi-ZmRALF pollen tubes, n = 21. The data are presented as the mean value ± Sds. Scale bars = 10 μm.

