Figure 9.
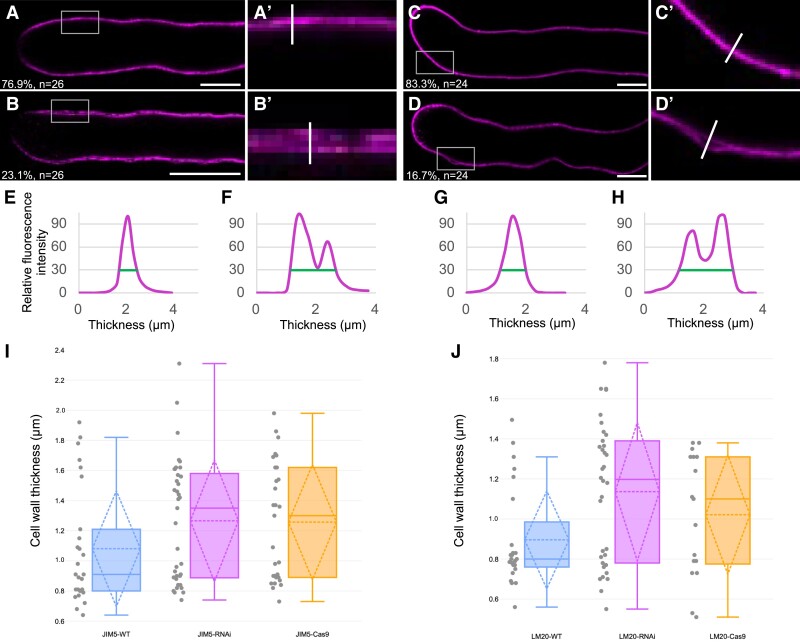
Cell wall organization pattern is altered in ZmRALF mutants. A and B) Representative images of JIM5 labeled WT pollen tubes. Cell walls either showed a thin homogenous line or were thicker and dilated showing partially 2 lines. The ratio of each category and the number of pollen tubes that were analyzed are indicated. A′ and B′) Enlargement of gray boxes in A and B), respectively. Scale bars = 10 μm. See Supplementary Fig. S13, A to D for ZmRALF mutant lines. C and D) Representative images of LM20 labeled WT pollen tubes. The ratio of each category like in A and B) and the number of pollen tubes that were analyzed are indicated. C′ and D′) Enlargement of gray boxes in C and D), respectively. Scale bars = 10 μm. See Supplementary Fig. S13, E to H for ZmRALF mutant lines. E to H) Quantification of relative fluorescence intensity of white lines shown in A′ to D′). Thickness of cell walls was measured with the criteria that relative fluorescence intensity was 30% (green lines). I and J) Box plot analysis of pollen tube cell wall thickness WT and ZmRALFs mutant lines after labeling with JIM5 I) and LM20 J), respectively. The thickness was defined with the same criteria as in E to H). Whiskers extend to min and max, box boundaries represent the 25th percentile (lower) and 75th percentile (upper), the lines inside boxes represent medians, Sd is displayed as a dashed rhombus, along with the mean and median values, and dots represent the individual data for each documented pollen tube.

