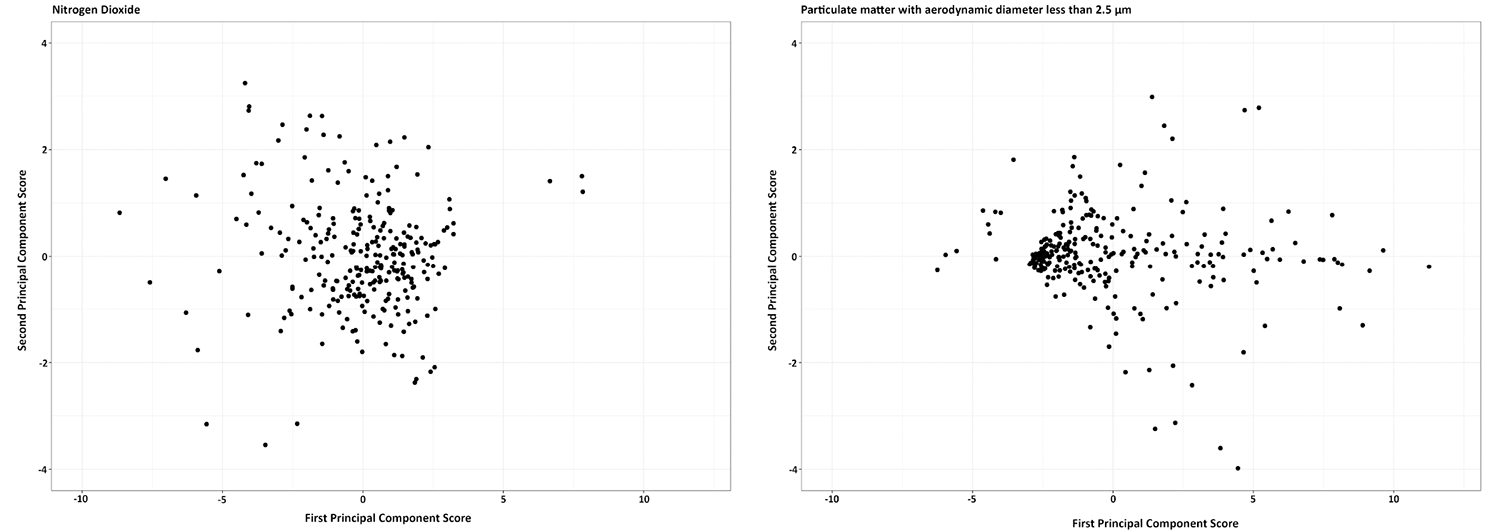
FIGURE 2.

Daily patterns of exposure to air pollutants by functional principal component analysis. Each dot represents an average day for a participant during the study period. First principal component score (Y axis) represents the overall low daily exposure (with little variation) to pollutants within 24 h and the second principal component score (X axis) presents the difference between daily and nighttime exposure. Data were from 3827 days of air monitoring in 273 participants between November 2019 and May 2022 in New York City metropolitan area.
