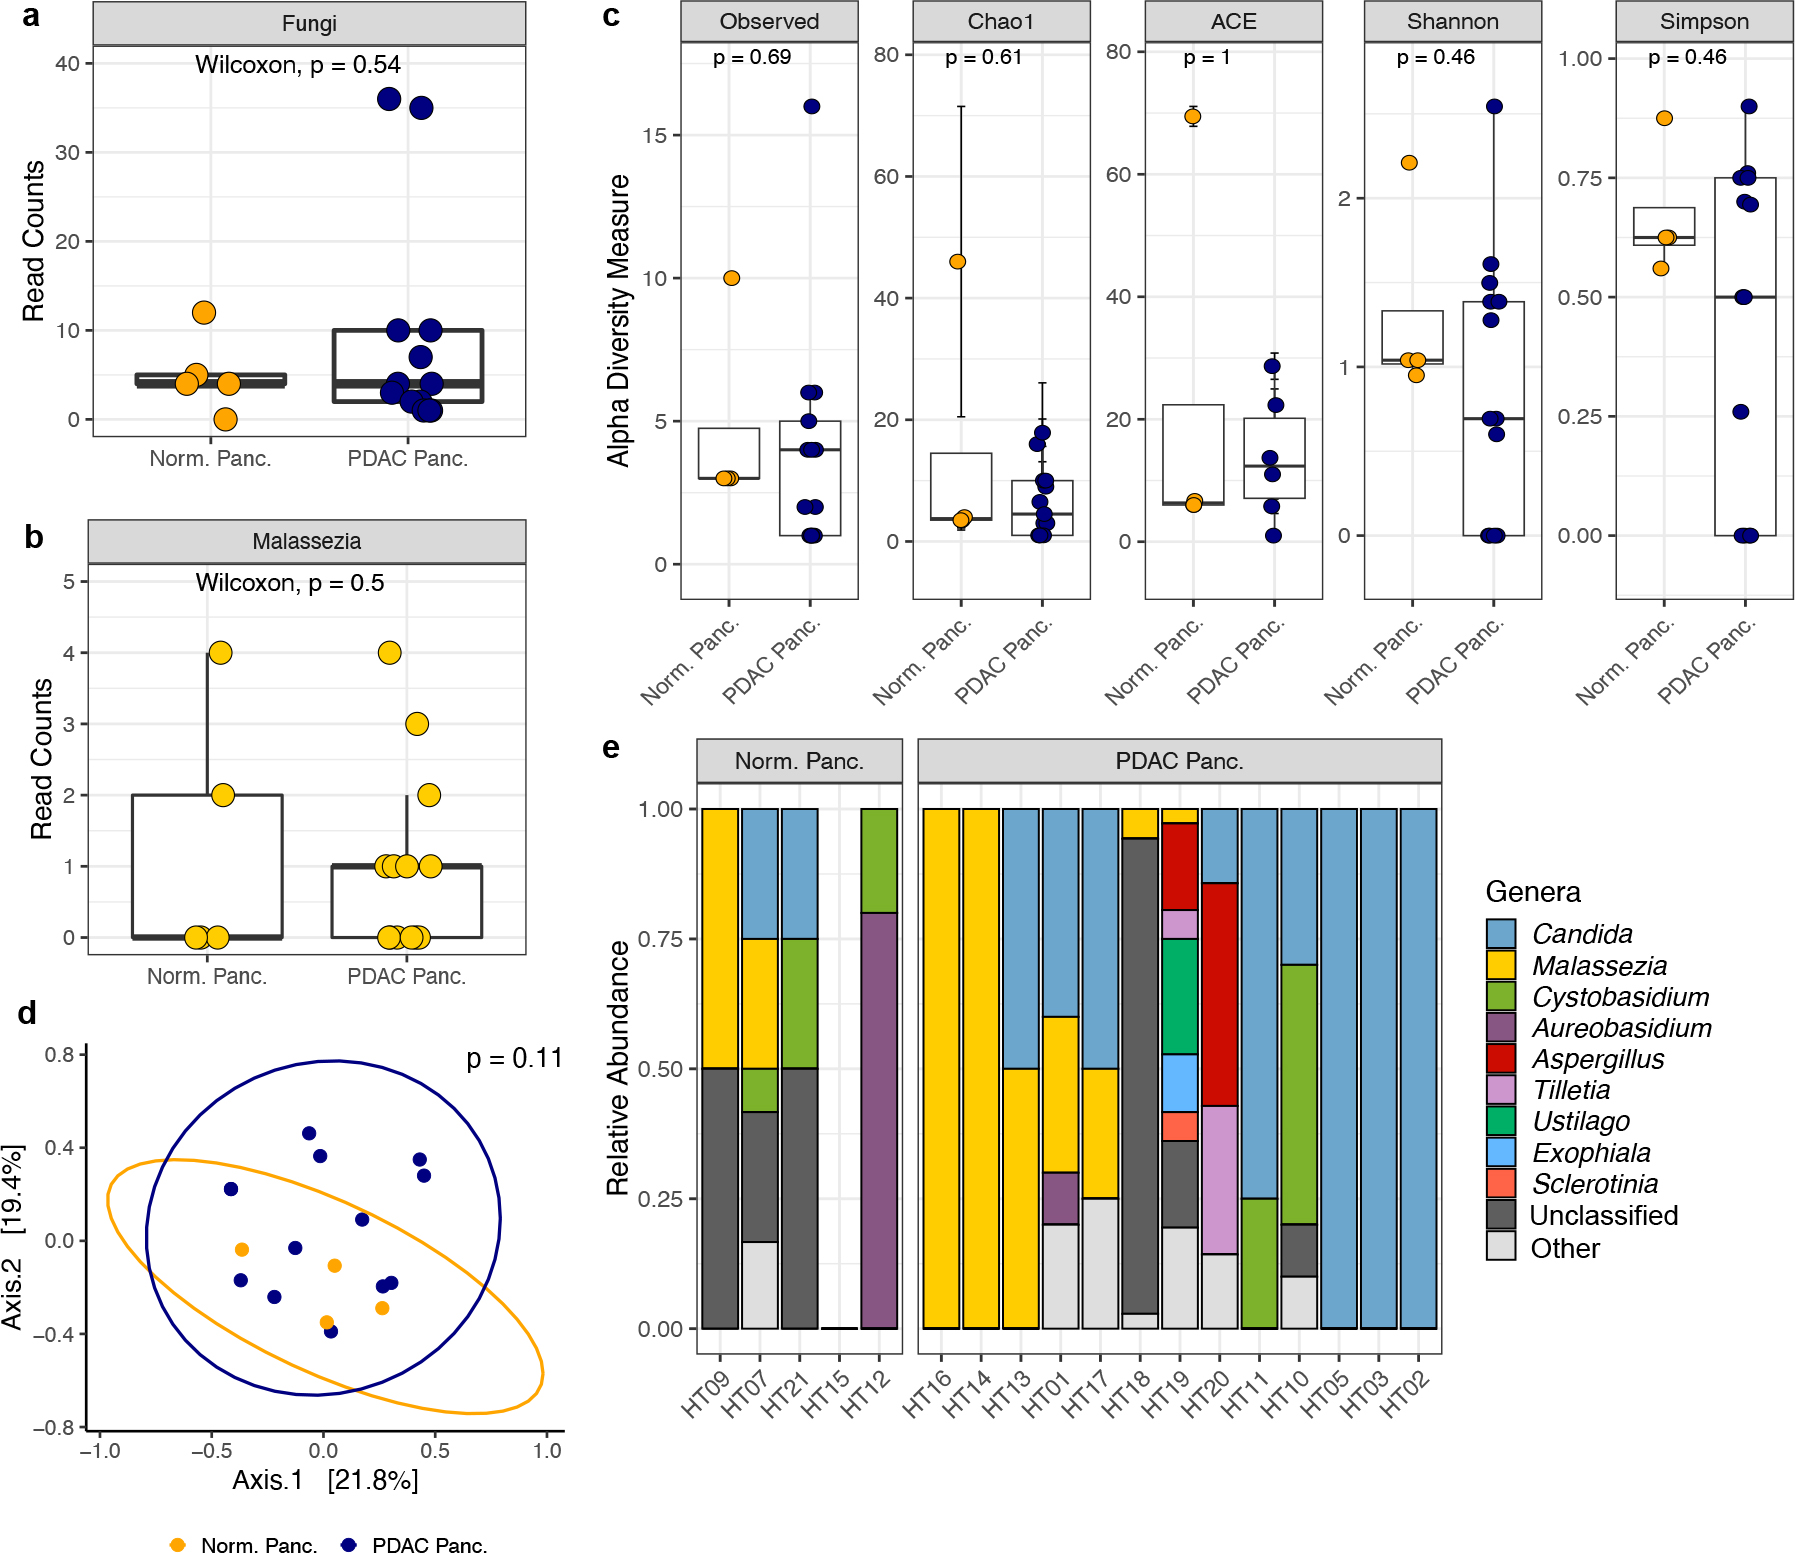
Fig. 1 |. QIIME2 re-analysis of human pancreatic ITS sequencing data made publicly available by Aykut et al.

a, Box plots depicting total fungal reads in normal pancreas tissue (n=5 biologically independent samples) and pancreatic ductal adenocarcinoma (PDAC) tissue (n=13 biologically independent samples). b, Box plots depicting sequencing reads assigned to the fungal genus Malassezia in normal pancreas tissue (n=5 biologically independent samples) and PDAC tissue (n=13 biologically independent samples). c, Alpha diversity measures of normal pancreas tissue (n=4 biologically independent samples) and PDAC tissue (n=13 biologically independent samples). Diversity measures shown are the number of observed taxa, the Chao1 index, abundance-based coverage estimates (ACE), and the Shannon and Simpson’s indices. d, Non-metric multi-dimensional scaling plot of normal pancreas tissue (n=4 biologically independent samples) and PDAC tissue (n=13 biologically independent samples) fungal communities, based on Bray–Curtis dissimilarity. e, Relative abundances of the top ten fungal genera identified in normal and PDAC pancreatic tissue samples. Box plot minima and maxima bounds represent the 25th and 75th percentiles, respectively; the centre bound represents the median (a, b, c). Whiskers extend to 1.5 times the interquartile range (IQR) (a, b), and data in c are presented as mean ± SEM after a single sample with zero fungal reads was dropped from the analysis. P values were estimated using two-sided Wilcoxon rank-sum tests (a, b, c) or two-way PERMANOVA (d). Individual data points are shown.
