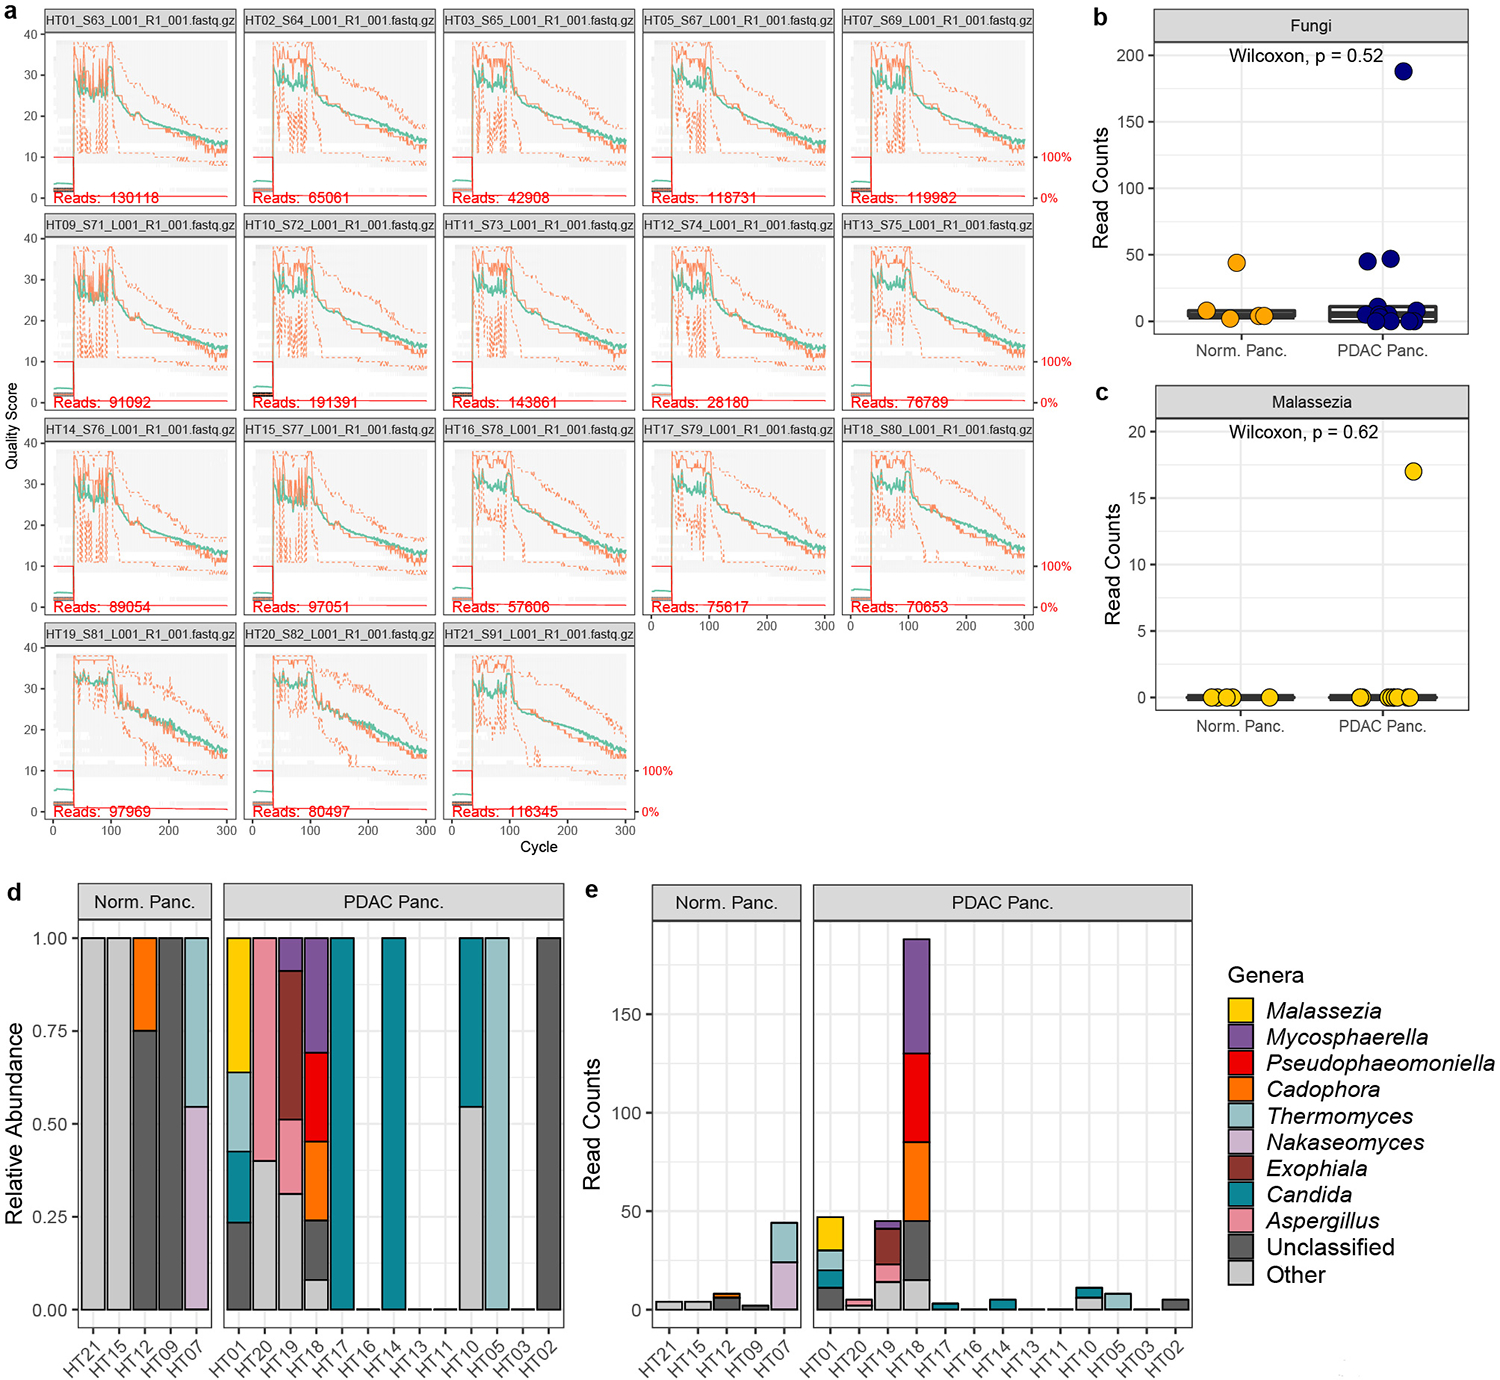
Extended Data Fig. 1 |. DADA2 analysis by Fletcher et al. of ITS sequencing data from Aykut et al. human pancreatic tissue samples.

a, Quality plot of raw sequencing reads. The y-axis represents the Phred quality score and the x-axis represents the cycle, which corresponds to the base position of sequencing reads. The mean quality score at each base position is shown by a green line and the quartiles of the quality score distribution are shown by orange lines. The number of sequencing reads in each sample is shown in red font. The red line shows the scaled proportion of reads that extend to at least that position. b, Box plots depicting fungal reads in normal pancreas tissue (n=5 biologically independent samples) and pancreatic ductal adenocarcinoma (PDAC) tissue (n=13 biologically independent samples) c, Box plots depicting sequencing reads assigned to the fungal genus Malassezia in normal pancreas (n=5 biologically independent samples) and PDAC tissue (n=13 biologically independent samples). d, Relative abundances, and e, read counts of the top ten fungal genera in pancreatic tissue samples from healthy individuals and patients with PDAC. Box plot minima and maxima bounds represent the 25th and 75th percentiles, respectively; the centre bound represents the median. Whiskers extend to 1.5 times the interquartile range (IQR). P values were estimated using two-sided Wilcoxon rank-sum tests (b, c). Individual data points are shown.
