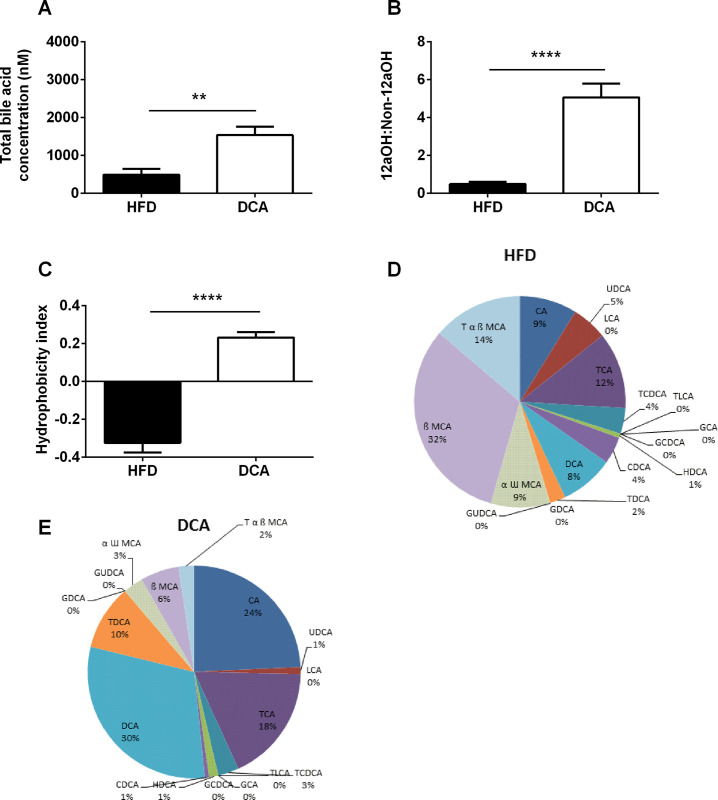
Fig 2. Fasting serum bile acid profile.
Total bile acid concentration (A), 12αOH:non-12αOH ratio (B) and hydrophobicity index (C) in fasting serum samples. Relative proportions of bile acid subtypes in fasting serum samples from HFD (D) and DCA treated (E) mice. Data are expressed as mean ± SEM, **P<0.01, ****P<0.0001 by Student’s t-test, n = 6 per group. CA, cholic acid; GCA, glycocholic acid; TCA, taurocholic acid; LCA, lithocholic acid; TLCA, taurolithocholic acid; HDCA, hyodeoxycholic acid; GUDCA, glycoursodeoxycholic acid; CDCA, chenodeoxycholic acid; GCDCA, glycochenodeoxycholic acid; TCDCA, taurochenodeoxycholic acid; UDCA, ursodeoxycholic acid; DCA, deoxycholic acid; GDCA, glycodeoxycholic acid; TDCA, taurodeoxycholic acid; α ω MCA, αω muricholic acid; β MCA, β-muricholic acid and T α β MCA, tauro-αβ muricholic acid.

