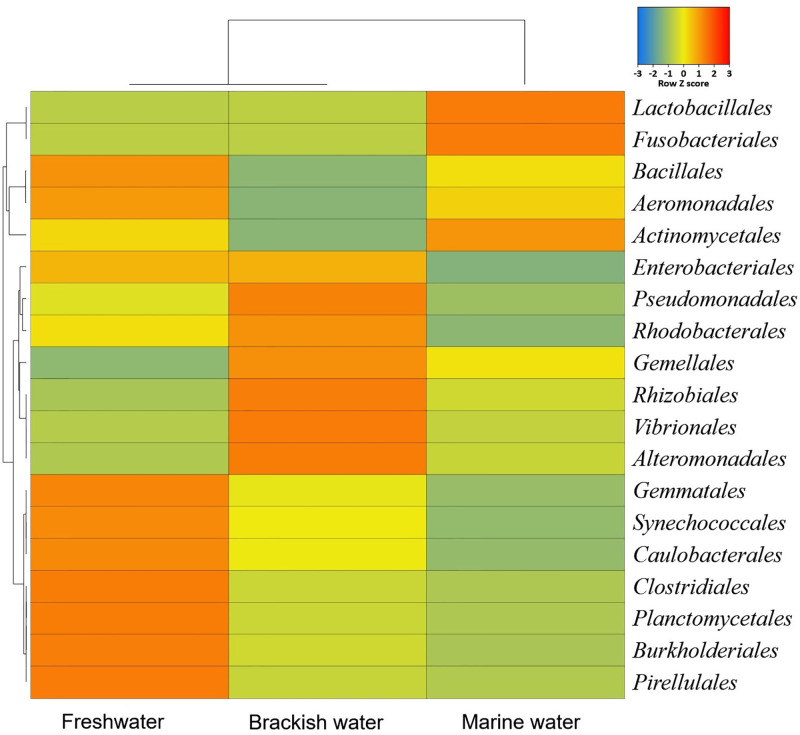
Fig 3. Taxonomic profile of bacteriomes in hilsa fish at the order level.
Heatmap showing the average relative abundances and hierarchical clustering of the bacterial orders in the study in freshwater (FW), brackish water (BW) and marine water (MW) samples. The colour bar (row Z score) at the top represents the relative abundance of the bacterial orders in the corresponding samples. The colour codes indicate the presence and completeness of each bacterial taxa, expressed as a value between = 3 (lowest abundance) and 3 (highest abundance). The red colour indicates the more abundant patterns, while blue cells account for less abundant bacterial orders in that particular sample.

