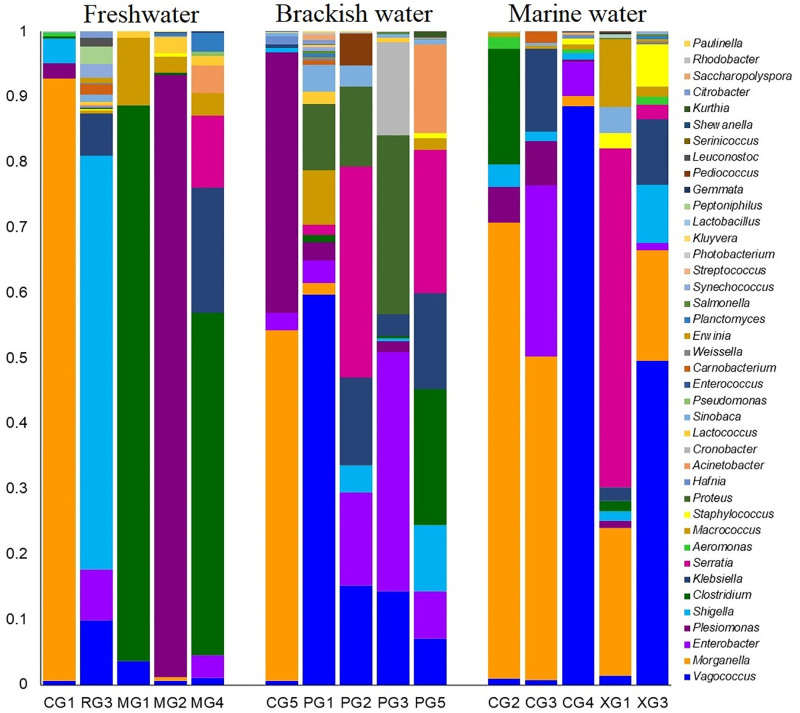
Fig 4. The genus-level taxonomic profile of bacteriomes.
The bar plots representing the relative abundance of 40 bacterial genera in freshwater (FW), brackish water (BW) and marine water (MW) samples. Each stacked bar plot represents the abundance of bacterial genera in each sample of the corresponding category. Notable differences in bacterial genera are those where the taxon is abundant in one habitat, and effectively not detected in rest of the two habitats. The distribution and relative abundance of the bacterial genera in the study metagenomes are also available in S1 Data.

