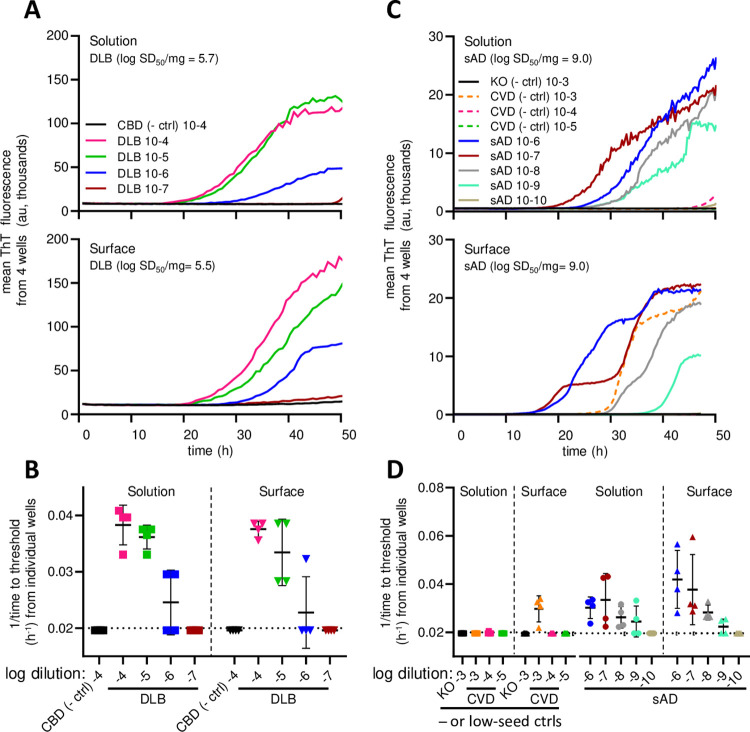
Fig 4. sfRT-QuIC detection of α-synuclein and tau seeding activity from brain homogenates.
Panel A. Designated dilutions of DLB or corticobasal degeneration (CBD, a non-synucleinopathy control) tested by solution or sfRT-QuIC. Curves are averages of 4 replicate reactions. Y-axis indicates mean ThT fluorescence from replicate wells and x-axis assay duration (h). Panel B 1/time to fluorescence positivity threshold for each DLB and CBD reaction versus the dilution (log10 tissue equivalents). The dotted horizontal line represents the inverse of the time of the final measurement. The dashed vertical line separates solution vs. surface data. The mean (heavy horizontal lines) and standard deviations (vertical) are displayed for each dilution tested. Panel C. Designated dilutions of sAD or cerebrovascular disease (CVD; a low tau seed control) BH tested by solution and sfRT-QuIC. Curves as in A. Panel D. 1/time to threshold for each reaction seeded with brain homogenate at the designated tissue dilutions from sAD, Tau KO (a tau-negative control), or CVD (a low, but not completely negative, tau seed control) with labeling as in B.

