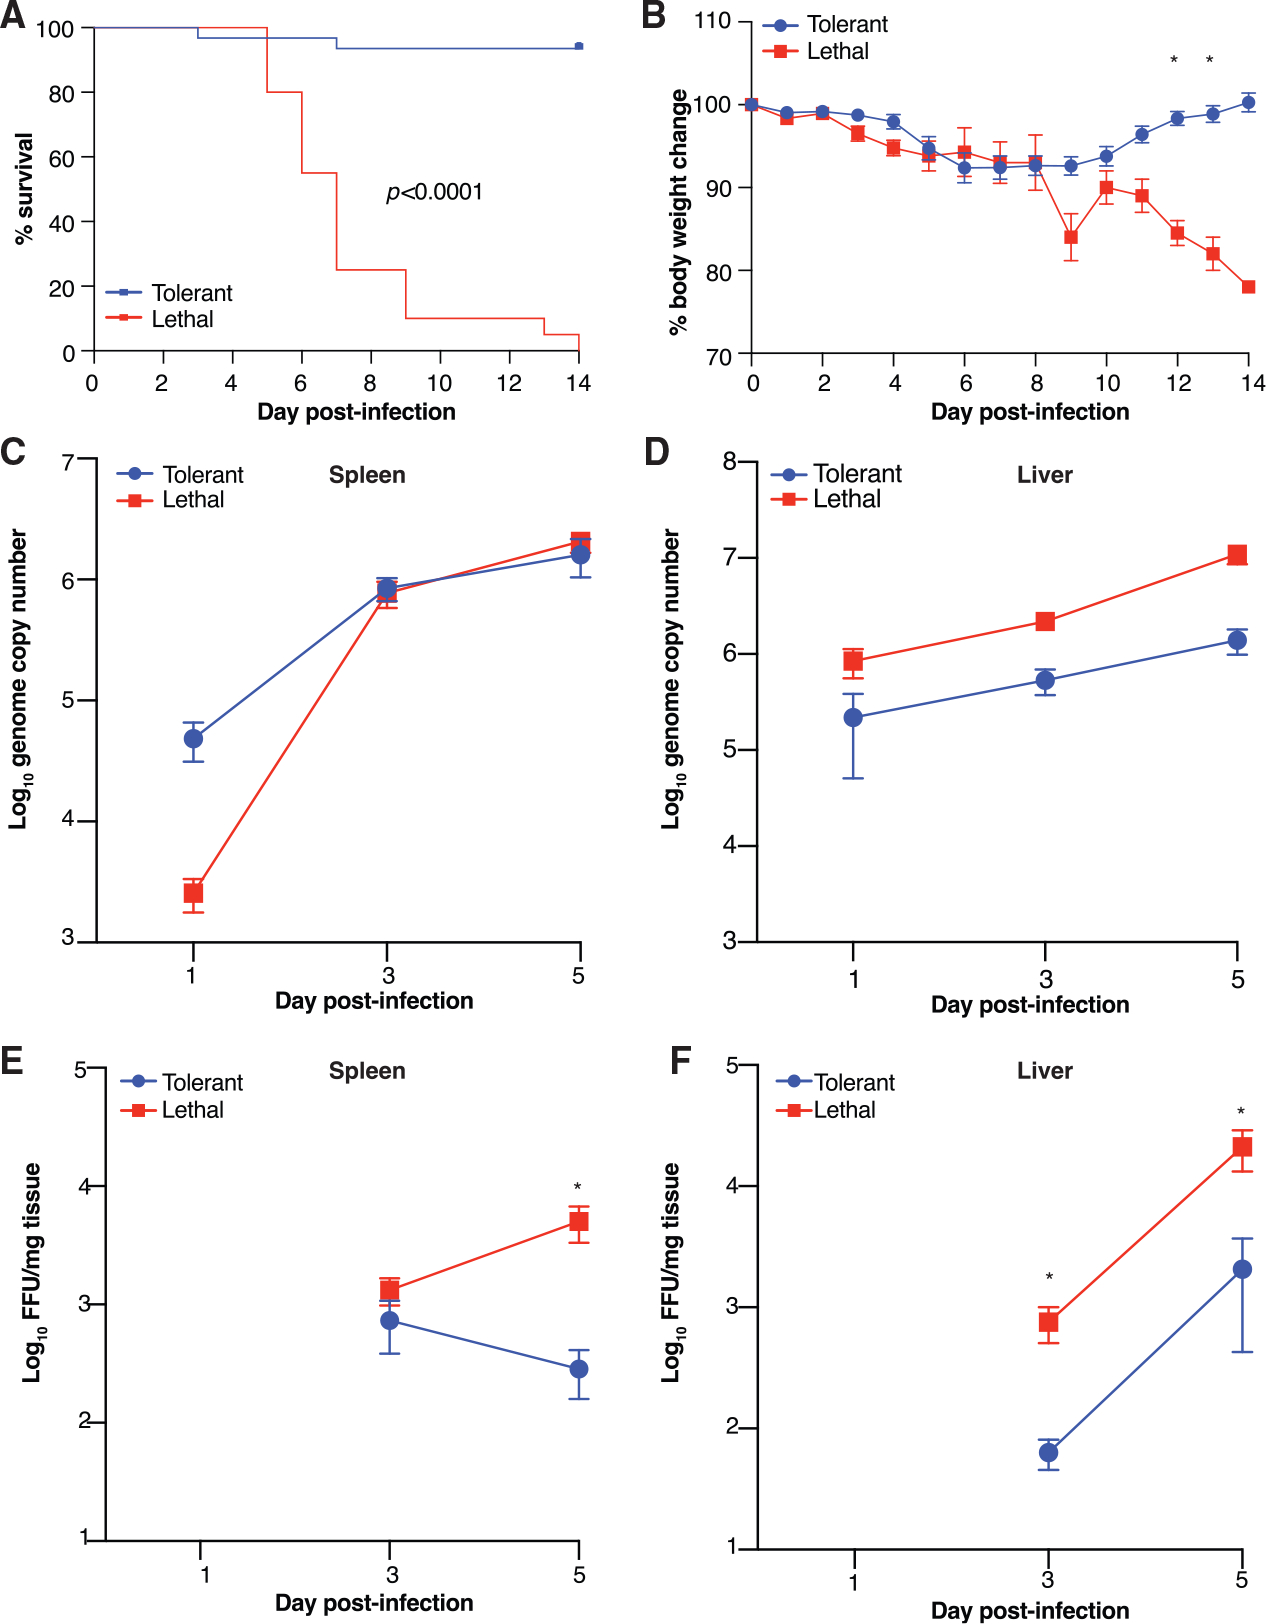
Figure 1. Infection and Disease Course in Tolerant and Lethal EVD.

(A) Kaplan-Meier survival curve comparing tolerant (blueline; 30 mice) versus lethal (red line; 20 mice) mice over 14 days p.i. Significance determined by the Mantel-Cox logrank test.
(B) Body weight percent change from the time of infection (day 0) recorded daily in mice used to assess mortality. * adjusted p < 0.001.
(C and D) MA-EBOV RNA genome copies in spleen (C) and liver (D) over a time course from tolerant (15 mice/time point) and lethal (12 mice/time point) outcomes. No viral RNA comparisons met significance criteria (adjusted p < 0.05).
(E and F) Viral titers in spleen (E) and liver (F) determined by focus forming assay (FFA) over a time course from tolerant (blue line; 15 mice per time point) and lethal (12 mice/time point) outcomes. * adjusted p < 0.01.
Significance was determined using multiple t tests with Bonferroni-Sidak multiple test correction. Viral titer assayed in duplicate. All error bars show SEM.
