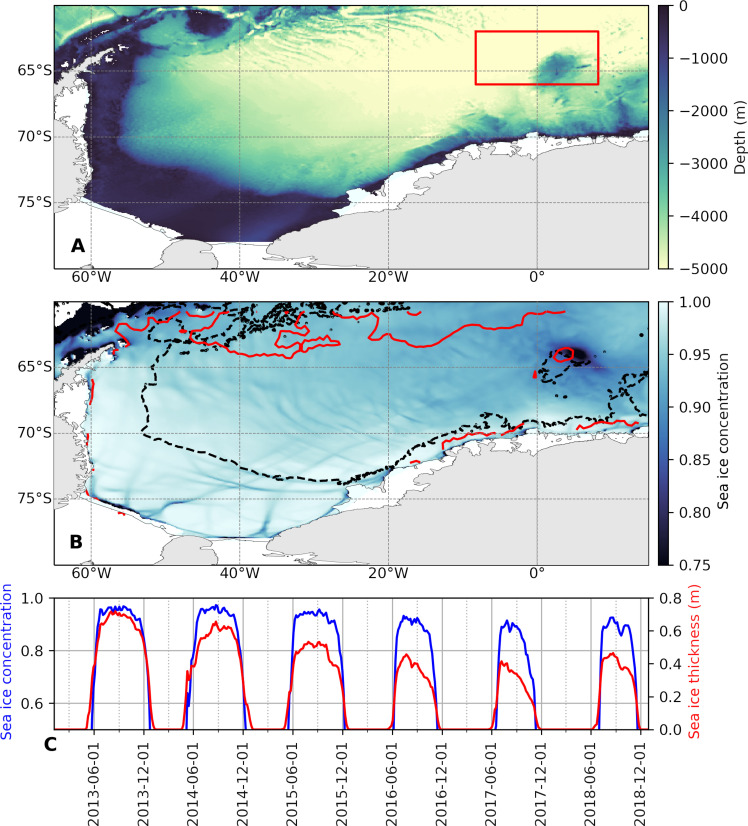
Fig. 1. Maud Rise within the Weddell Sea.
(A) Bathymetry of the Weddell Sea as represented in SOSE. The Maud Rise is enclosed within the red box (study region). (B) Modeled sea ice concentration (SIC) averaged over September2017 from SOSE output, showing the formation of the Maud Rise polynya. The red contour is the September-averaged SIC from satellite observations, plotted for a SIC of 0.75. The black contours indicate the 3000-m isobath. (C) Area-averaged SIC [over the area enclosed by the red lines in (A)] and effective sea ice thickness (sea ice volume per unit area) from SOSE.

